Building a Project / Task Board with a Svelte Data Grid
How to build a task management grid with grouping by status or assignee, inline edits, subtask tree rows, and saved views - without reaching for a dedicated project management tool.
Kanban boards look great in demos. In practice, when a sprint has 80 tasks spread across 6 engineers, a drag-and-drop board becomes a scrolling nightmare. A grid view with grouping, inline editing, and fast keyboard navigation handles that volume much better. I've seen teams switch from purpose-built project tools to a well-configured data grid and never look back.
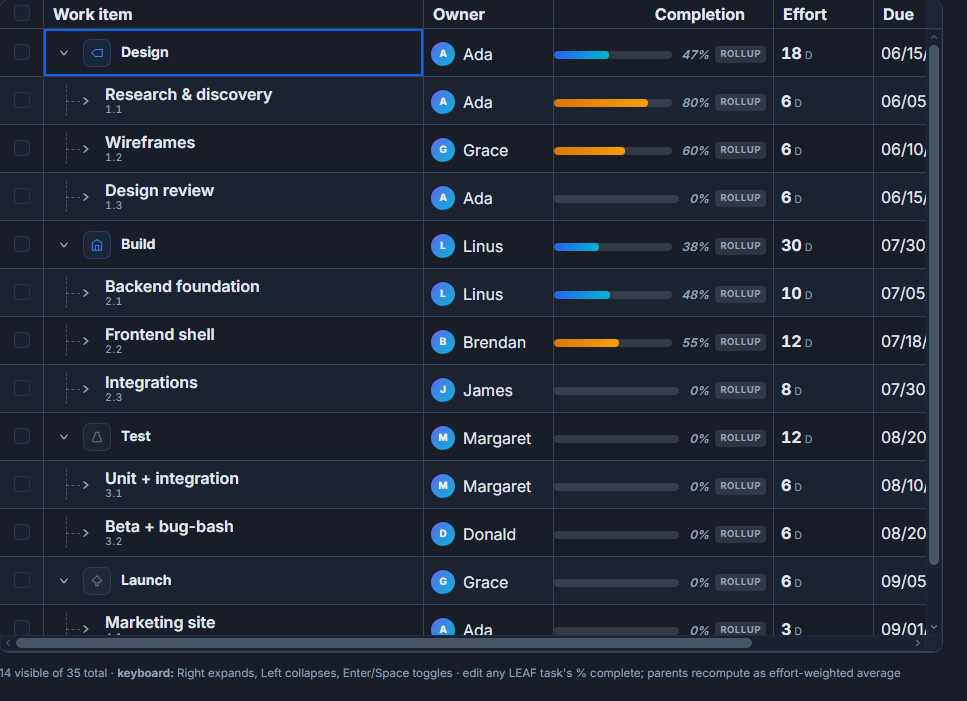 A project breakdown as tree rows in SvGrid.
The data model that makes everything else easier
Before writing a single column definition, get the data shape right. Tasks with subtasks need a parentId field - SvGrid's tree data feature uses this to build the hierarchy client-side. You don't need a recursive structure; a flat array with parent references is enough.
// types.ts
export interface Task {
  id: string
  parentId: string | null
  title: string
  assignee: string
  status: 'todo' | 'in-progress' | 'done' | 'blocked'
  priority: 'low' | 'medium' | 'high' | 'critical'
  dueDate: string | null  // ISO date string
  storyPoints: number | null
  sprint: string
}
The parentId: null tasks are root-level; anything with a parentId is a subtask. This flat-with-references pattern is what most APIs return anyway, so you can often skip a transformation step.
Column definitions: what to show and how to edit it
The column setup does most of the heavy lifting. Status and priority are the most-edited fields in any task board, so make them fast to edit in place rather than opening a dialog.
<script lang="ts">
  import SvGrid from '@svgrid/grid'
  import type { ColumnDef } from '@svgrid/grid'
  import type { Task } from './types'

  let api: any

  const statusOptions = ['todo', 'in-progress', 'done', 'blocked']
  const priorityOptions = ['low', 'medium', 'high', 'critical']

  const statusColors: Record<string, string> = {
    'todo': '#94a3b8',
    'in-progress': '#3b82f6',
    'done': '#22c55e',
    'blocked': '#ef4444',
  }

  const priorityColors: Record<string, string> = {
    'low': '#94a3b8',
    'medium': '#f59e0b',
    'high': '#f97316',
    'critical': '#dc2626',
  }

  const columns: ColumnDef<any, Task>[] = [
    {
      id: 'title',
      field: 'title',
      header: 'Task',
      width: 320,
      editable: true,
      pinned: 'left',
    },
    {
      id: 'assignee',
      field: 'assignee',
      header: 'Assignee',
      width: 140,
      editable: true,
    },
    {
      id: 'status',
      field: 'status',
      header: 'Status',
      width: 130,
      editable: true,
      cell: statusCell,
      conditionalFormat: [
        { condition: ({ row }) => row.original.status === 'blocked',
          style: { background: '#fef2f2' } },
      ],
    },
    {
      id: 'priority',
      field: 'priority',
      header: 'Priority',
      width: 110,
      editable: true,
      cell: priorityCell,
    },
    {
      id: 'dueDate',
      field: 'dueDate',
      header: 'Due',
      width: 110,
      type: 'date',
      editable: true,
      conditionalFormat: [
        {
          condition: ({ value }) => {
            if (!value) return false
            return new Date(value) < new Date()
          },
          style: { color: '#dc2626', fontWeight: '600' },
        },
      ],
    },
    {
      id: 'storyPoints',
      field: 'storyPoints',
      header: 'SP',
      width: 60,
      type: 'number',
      editable: true,
    },
    {
      id: 'sprint',
      field: 'sprint',
      header: 'Sprint',
      width: 110,
      editable: true,
    },
  ]
</script>

{#snippet statusCell({ value }: { value: string })}
  <span class="status-badge" style="background: {statusColors[value]}20; color: {statusColors[value]}; border: 1px solid {statusColors[value]}40">
    {value}
  </span>
{/snippet}

{#snippet priorityCell({ value }: { value: string })}
  <span class="priority-dot" style="color: {priorityColors[value]}">
    ● {value}
  </span>
{/snippet}

<SvGrid
  {data}
  {columns}
  sortable
  filterable
  groupable
  editable
  showFilterRow={true}
  enableCellSelection={true}
  rowHeight={36}
  virtualization={true}
  onApiReady={(a) => { api = a }}
/>
The conditionalFormat on the due date column is one of those small details that makes a task board genuinely useful - overdue tasks turn red automatically without any custom cell renderer.
Grouping by status gives you a lightweight board view
Grouping is where the grid earns its keep over a plain table. Group by status and you get something that looks like a Kanban board but lets you sort within each group, bulk-select, and see aggregated story points per column.
// Toggle grouping mode programmatically
function groupByStatus() {
  api.setGroupBy(['status'])
  api.expandAllGroups()
}

function groupByAssignee() {
  api.setGroupBy(['assignee'])
  api.expandAllGroups()
}

function groupBySprint() {
  api.setGroupBy(['sprint', 'status'])
  api.expandAllGroups()
}

function clearGrouping() {
  api.setGroupBy([])
}
The two-level grouping ['sprint', 'status'] is particularly useful for sprint planning - you see each sprint broken into status buckets with counts and story point totals per group.
Subtasks as tree rows
SvGrid handles tree data by reading parentId and building the hierarchy automatically. Parent tasks show expand/collapse controls; subtasks are indented. You get rollup aggregation on the parent - so if a parent has 3 done subtasks out of 5, you can show "3/5" in a custom cell.
The tree feature activates when you pass a getSubRows option. For a flat array with parentId:
import SvGrid from '@svgrid/grid'

// SvGrid resolves the hierarchy from your flat data
// Pass getSubRows to define how children are found
const gridOptions = {
  data: tasks,     // flat Task[] with parentId
  columns,
  getSubRows: (row: Task, allRows: Task[]) =>
    allRows.filter(r => r.parentId === row.id),
}
One thing to watch: if your dataset is large (thousands of tasks), the getSubRows traversal runs on every render cycle. For that scale, pre-build a children map once and reference it:
const childMap = new Map<string | null, Task[]>()
for (const task of tasks) {
  const bucket = childMap.get(task.parentId) ?? []
  bucket.push(task)
  childMap.set(task.parentId, bucket)
}

const getSubRows = (row: Task) => childMap.get(row.id) ?? []
The pre-built map turns O(n) per-row lookups into O(1). For 5,000 tasks with deep subtask nesting, this is the difference between 60fps and noticeable jank.
Saving views so engineers can get back to their context
Every engineer has a personal filter they run every day: "show me my in-progress tasks for Sprint 12, sorted by priority". Making that view persistent costs three lines:
import { createNamedViews, localStorageViews } from '@svgrid/grid'

const views = createNamedViews({
  storage: localStorageViews('task-board'),
})

// Save current filters, grouping, column order, and sort
function saveView(name: string) {
  const state = api.getState()
  views.save(name, state)
}

// Restore a saved view
function loadView(name: string) {
  const state = views.load(name)
  if (state) api.setState(state)
}

// Get the list of saved view names for a dropdown
const savedViews = views.list()
getState() captures filters, sorts, grouping, column widths, visibility, and pinning in one call. setState() restores all of it. You can serialize this to a URL for shareable views, or push it to a database so views survive across devices.
Bulk operations for fast triage
When a sprint ends and you need to move 15 tasks from "in-progress" to "done", selecting each task individually is painful. Select all with Ctrl+A, or select a range, then apply a transaction:
function bulkMarkDone() {
  const selected = api.getSelectedRows()
  const updates = selected.map(row => ({
    ...row,
    status: 'done' as const,
  }))
  api.applyTransaction({ update: updates })
}

function bulkReassign(newAssignee: string) {
  const selected = api.getSelectedRows()
  api.applyTransaction({
    update: selected.map(row => ({ ...row, assignee: newAssignee })),
  })
}
applyTransaction is optimistic - the grid updates instantly. Wire up your API call alongside it and roll back if the server rejects it. That pattern keeps the UI snappy even with a slow backend.
When a dedicated tool makes more sense
The grid approach works well when you need speed, density, and customization. It struggles when your primary workflow is visual drag-and-drop ordering (a real Kanban board is better for that), or when non-technical users need a polished no-config experience.
If your users are engineers or analysts who live in spreadsheets, the grid will feel natural. If they're used to a visual board, expect a learning curve. The good news is you can ship both - a Kanban view and a grid view pulling from the same data - because the grid is just a rendering layer over your task state. Setting the board prop renders these same rows as draggable cards; see building a Kanban board in Svelte 5 for that side of it.
The conditional row highlighting for blocked tasks, the overdue date coloring, the instant group-by toggle - these are the details that make an internal tool feel finished. They're also the kind of details that take weeks to build in a custom table but come out of the box here.
Related reading
- Building a SaaS Billing and Usage Table in Svelte
- Building a Real-Time Trading Grid in Svelte
- Building an Order Management Dashboard in Svelte
- Building a Logistics / Fleet Tracking Grid in Svelte
- Building a Log Viewer for Large Logs in Svelte
Tagged: Row grouping