Building a Log Viewer for Large Logs in Svelte
How to build a production-ready log viewer with SvGrid - virtualization for millions of lines, severity coloring, live tailing with scroll-lock, and server-side filtering.
Most grid demos show 1,000 rows of fake employee data. A log viewer is the opposite: real production logs routinely run into the hundreds of thousands of lines, spike to millions during incidents, and keep arriving in real time while someone is actively scrolling through them. If your grid can't handle that without choking the main thread, it's not useful for this case.
SvGrid handles it well because virtualization is on by default and the live-update path is fast. Here's a complete blueprint.
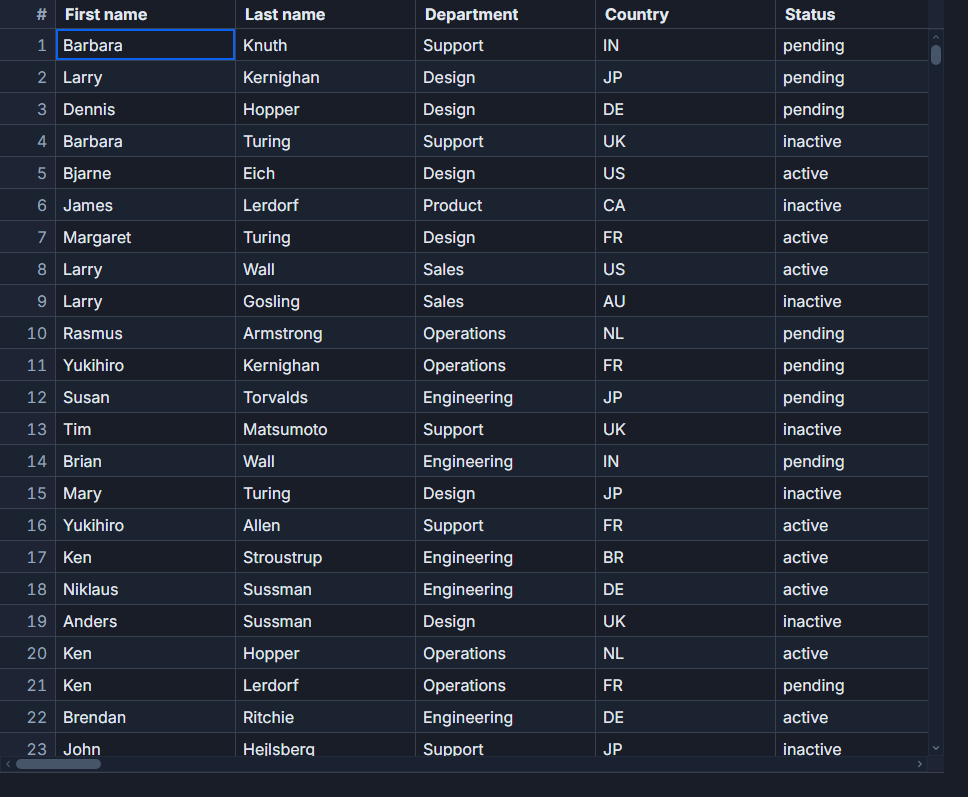 Virtualization keeps the DOM bounded regardless of how many log lines are buffered.
Column layout that actually works for logs
The column shape matters. Timestamp, level, source, and message are the four you always need, and each has a specific display concern:
<script>
  import SvGrid from '@svgrid/grid'

  const columns = [
    {
      id: 'ts',
      field: 'ts',
      header: 'Timestamp',
      width: 185,
      pinned: 'left',
      cell: tsSnippet,
    },
    {
      id: 'level',
      field: 'level',
      header: 'Level',
      width: 80,
      cell: levelSnippet,
      conditionalFormat: [
        { condition: ({ value }) => value === 'ERROR', style: { background: '#3b0000', color: '#ff6b6b' } },
        { condition: ({ value }) => value === 'WARN',  style: { background: '#2a1a00', color: '#ffa94d' } },
        { condition: ({ value }) => value === 'DEBUG', style: { color: '#666' } },
      ],
    },
    {
      id: 'source',
      field: 'source',
      header: 'Source',
      width: 160,
    },
    {
      id: 'message',
      field: 'message',
      header: 'Message',
      width: 600,
    },
  ]
</script>

{#snippet tsSnippet({ value })}
  <span style="font-family: monospace; font-size: 12px">{value}</span>
{/snippet}

{#snippet levelSnippet({ value })}
  <span class="level-badge level-{value?.toLowerCase()}">{value}</span>
{/snippet}

<SvGrid
  data={logBuffer}
  {columns}
  virtualization={true}
  rowHeight={28}
  filterable
  showFilterRow={true}
  showGlobalFilter={true}
  onApiReady={(a) => { api = a }}
/>
Pin the timestamp left. The message column should be wide - people scan it with their eyes horizontally, and truncation at 200px makes the grid nearly useless during debugging. If you want full message text on demand, expanding the row beats a tooltip for logs because messages can be 2,000 characters of stack trace.
Why uniform row height is non-negotiable at scale
Virtualization works by calculating which rows are visible based on scroll position and row height. If every row has a different height, the grid has to measure every row above the viewport to know the scroll offset - which defeats the whole point at a million rows.
Set rowHeight to a fixed pixel value. Use monospace for timestamps so they don't reflow. If you need expandable rows for full stack traces, that's fine - just keep the collapsed state at a uniform height. The performance difference between variable-height and fixed-height virtualization at 500k rows is not subtle.
Severity coloring without a custom renderer
The conditionalFormat array on each column applies CSS styles inline based on cell value. This is fast because it runs during render, not in a separate pass. Coloring the level column handles the badge; if you also want to tint the whole row, apply the same conditions at the row level:
<script>
  import SvGrid from '@svgrid/grid'

  const rowClass = ({ row }) => {
    if (row.level === 'ERROR') return 'row-error'
    if (row.level === 'WARN')  return 'row-warn'
    return ''
  }
</script>

<SvGrid
  data={logBuffer}
  {columns}
  {rowClass}
  virtualization={true}
  rowHeight={28}
/>

<style>
  :global(.row-error) { background-color: rgba(180, 0, 0, 0.08) !important; }
  :global(.row-warn)  { background-color: rgba(180, 100, 0, 0.06) !important; }
</style>
The first thing anyone does when opening a log viewer is filter to errors. Make that painless - a dedicated level filter in the filter row plus a one-click "errors only" button wired to api.setFilter('level', { operator: 'equals', value: 'ERROR' }) covers 80% of the use cases before they even type anything.
Server-side filtering for very large datasets
For a live system, you don't want to buffer millions of rows in the browser. You want to query the log backend and page through results. createServerDataSource handles this:
<script>
  import SvGrid, { createServerDataSource } from '@svgrid/grid'

  const ds = createServerDataSource({
    fetch: async ({ page, pageSize, sort, filters }) => {
      const params = new URLSearchParams({
        page: String(page),
        size: String(pageSize),
      })

      for (const [field, filter] of Object.entries(filters ?? {})) {
        if (filter?.value) params.set(field, filter.value)
      }

      if (sort?.length) {
        params.set('sort_field', sort[0].id)
        params.set('sort_dir', sort[0].desc ? 'desc' : 'asc')
      }

      const res = await fetch(`/api/logs?${params}`)
      const json = await res.json()
      return { rows: json.entries, total: json.total }
    }
  })
</script>

<SvGrid
  data={ds}
  {columns}
  filterable
  pageable
  showFilterRow={true}
/>
The filter state flows directly from the grid UI into your fetch parameters. Add debounce on the text inputs if your backend can't handle a query per keystroke.
Live tailing without yanking the user
Tailing - new lines appending at the bottom while someone is scrolled up reading old lines - is the hardest part to get right. The failure mode is aggressive: the grid auto-scrolls to the bottom on every new batch, interrupting whoever is investigating an issue. The correct behavior is:
- If the user is at (or very near) the bottom, auto-scroll to follow new lines.
- If they have scrolled up at all, stop auto-scrolling. Let them read.
- Resume auto-scroll if they scroll back to the bottom themselves.
<script>
  import SvGrid from '@svgrid/grid'

  let api = $state(null)
  let logBuffer = $state([])
  let userScrolledUp = false
  let raf = null

  function onScroll(event) {
    const el = event.target
    const atBottom = el.scrollHeight - el.scrollTop - el.clientHeight < 40
    userScrolledUp = !atBottom
  }

  function appendLogs(newLines) {
    if (raf) cancelAnimationFrame(raf)
    raf = requestAnimationFrame(() => {
      logBuffer = [...logBuffer.slice(-50000), ...newLines]
      if (!userScrolledUp && api) {
        api.scrollToRow(logBuffer.length - 1)
      }
    })
  }

  // Wire to your WebSocket or EventSource
  const ws = new WebSocket('/ws/logs')
  ws.addEventListener('message', (e) => {
    const batch = JSON.parse(e.data)
    appendLogs(batch)
  })
</script>

<div class="log-container" on:scroll={onScroll}>
  <SvGrid
    data={logBuffer}
    {columns}
    virtualization={true}
    rowHeight={28}
    filterable
    onApiReady={(a) => { api = a }}
  />
</div>

<style>
  .log-container {
    height: 100vh;
    overflow: auto;
  }
</style>
The slice(-50000) caps the in-memory buffer. Without a cap, a process that logs at 10k lines per minute will consume gigabytes of RAM over hours. 50,000 lines is usually enough history for incident investigation; adjust based on what your backend already retains and queryable.
Batching to requestAnimationFrame is critical when log velocity is high. A firehose pushing 200 messages per second would trigger 200 Svelte state updates per second without batching, which kills performance. Coalescing those into one update per frame keeps the grid smooth.
The filter you'll add last but users ask for first
Time range filtering. Most log backends support from and to timestamp parameters, and users almost always want "show me the 10 minutes around when the alert fired." Add two datetime inputs bound to filter state and wire them to your server-side fetch or to a client-side filter on the timestamp field:
<script>
  let fromTs = $state('')
  let toTs = $state('')

  $effect(() => {
    if (!api) return
    if (fromTs) {
      api.setFilter('ts', { operator: 'gte', value: fromTs })
    } else {
      api.clearFilter?.('ts')
    }
  })
</script>

<div class="toolbar">
  <input type="datetime-local" bind:value={fromTs} />
  <input type="datetime-local" bind:value={toTs} />
  <button onclick={() => api.setFilter('level', { operator: 'equals', value: 'ERROR' })}>
    Errors only
  </button>
  <button onclick={() => api.clearAllFilters()}>Clear filters</button>
</div>
The "errors only" button and clear filters are worth adding as dedicated UI elements rather than relying on the filter row alone. During a production incident, people are moving fast and don't want to type.
What actually breaks at scale
A few things that will bite you in production that aren't obvious from a demo:
Timestamps with milliseconds tend to be stored as strings in logs, and string comparison sorts them lexicographically correctly only if the format is ISO 8601 with zero-padded fields. If your backend sends 1/5/2026 9:04:03 AM, sorting breaks. Parse to Date objects or to epoch milliseconds before putting them in the buffer.
Message columns with ANSI escape codes from terminal output look like noise: \x1b[32mINFO\x1b[0m connected. Strip escape codes server-side or in a column valueFormatter before render.
If you're rendering 10k rows with conditionalFormat on every column, measure. Conditional formatting runs a comparison per cell per render. For a log viewer where most rows are INFO, short-circuiting on the common case (checking for ERROR first) keeps the hot path fast.
The grid itself isn't the bottleneck at typical log volumes. The bottleneck is usually JSON.parse on the WebSocket messages, or Svelte reactivity triggered on every individual append. Batching at the data layer - not at the grid layer - is where you get the performance back.
Related reading
- Render 100,000 Rows Smoothly with Grid Virtualization
- Building a SaaS Billing and Usage Table in Svelte
- Building a Real-Time Trading Grid in Svelte
- Building a Project / Task Board with a Svelte Data Grid
- Building an Order Management Dashboard in Svelte
Tagged: Virtualization