Building a Logistics / Fleet Tracking Grid in Svelte
How to build a live fleet operations grid with real-time telemetry updates, expandable trip history, and exception-first row styling.
Fleet dispatchers don't browse data - they triage it. A vehicle goes offline at 3am and nobody notices until a delivery window is missed. The grid has one job: put the exception in front of the person who can fix it before the customer calls.
This post builds out a real fleet tracking grid: live telemetry updates, color-coded delay indicators, lazy-loaded trip history per vehicle, and a filter toggle that surfaces only the rows that need attention. Each piece is its own decision worth thinking through.
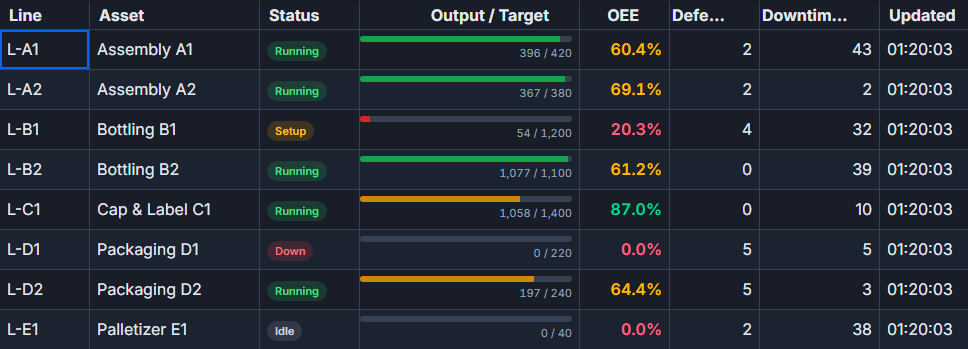 A fleet operations board built with SvGrid.
Column layout and left-pinned identity
Start with what dispatchers need at a glance: vehicle ID, driver, current status, location, ETA, and how late they are. Vehicle and driver should be pinned left so they remain visible when the table scrolls horizontally on smaller screens.
<script lang="ts">
  import SvGrid from '@svgrid/grid'
  import type { ColumnDef } from '@svgrid/grid'
  import type { Vehicle } from './types'

  const columns: ColumnDef<typeof features, Vehicle>[] = [
    { id: 'vehicle', field: 'vehicleId', header: 'Vehicle', width: 120, pinned: 'left' },
    { id: 'driver', field: 'driverName', header: 'Driver', width: 160, pinned: 'left' },
    { id: 'status', field: 'status', header: 'Status', width: 110, cell: statusCell },
    { id: 'location', field: 'currentStop', header: 'Location', width: 200 },
    { id: 'eta', field: 'eta', header: 'ETA', width: 100, type: 'date' },
    { id: 'delay', field: 'delayMinutes', header: 'Delay (min)', width: 110, type: 'number',
      conditionalFormat: [
        { condition: ({ value }) => value > 60, style: { color: '#dc2626', fontWeight: 'bold' } },
        { condition: ({ value }) => value > 15 && value <= 60, style: { color: '#d97706' } },
        { condition: ({ value }) => value <= 0, style: { color: '#16a34a' } },
      ]
    },
    { id: 'lastSeen', field: 'lastUpdateAt', header: 'Last Update', width: 140, type: 'date',
      conditionalFormat: [
        { condition: ({ value }) => isStale(value), style: { color: '#9ca3af', fontStyle: 'italic' } },
      ]
    },
  ]

  function isStale(ts: string): boolean {
    return Date.now() - new Date(ts).getTime() > 5 * 60 * 1000
  }
</script>

{#snippet statusCell({ value }: { value: string })}
  <span class="badge badge--{value.toLowerCase()}">{value}</span>
{/snippet}

<SvGrid
  {data}
  {columns}
  sortable
  filterable
  rowHeight={36}
  virtualization={true}
  showFilterRow={true}
  onApiReady={(a) => { api = a }}
/>
The conditionalFormat on the delay column does what a simple formatter can't: it changes the visual weight of the cell based on severity without any custom cell renderer. Red and bold for anything over an hour, amber for 15-60 minutes, green for on time or early.
Pushing telemetry updates without re-rendering the world
Telemetry arrives fast - typically one update per vehicle every 10-30 seconds for a mid-size fleet, but potentially hundreds per minute during route changes. The right pattern is to batch updates with applyTransaction rather than swapping the entire data array, which would force a full re-render and lose scroll position.
<script lang="ts">
  import SvGrid, { type SvGridApi } from '@svgrid/grid'

  let api: SvGridApi

  // Connect to your telemetry source - WebSocket, SSE, or polling
  function connectTelemetry() {
    const ws = new WebSocket('/api/fleet/telemetry')

    let pending: Vehicle[] = []
    let rafId: number

    ws.onmessage = (event) => {
      const update: Vehicle = JSON.parse(event.data)
      pending.push(update)

      cancelAnimationFrame(rafId)
      rafId = requestAnimationFrame(() => {
        if (pending.length > 0 && api) {
          api.applyTransaction({ update: pending })
          pending = []
        }
      })
    }

    ws.onclose = () => setTimeout(connectTelemetry, 3000)
    return () => ws.close()
  }

  $effect(() => {
    return connectTelemetry()
  })
</script>
Batching to the animation frame means no matter how many messages arrive between frames, the grid paints once. On a fleet of 2000 vehicles with updates coming in at 100/second, the difference between this and naive .data = newData is the difference between a usable app and a slideshow.
Trip history per vehicle
Expand a vehicle row to see its stops and completed legs. The detail panel should load lazily - pulling all trip history upfront would make the initial load slow and waste bandwidth on vehicles the dispatcher never expands.
<script lang="ts">
  import SvGrid, { rowExpandingFeature, tableFeatures } from '@svgrid/grid'
  import type { ColumnDef } from '@svgrid/grid'

  const features = tableFeatures({ rowExpandingFeature })

  const tripColumns: ColumnDef<typeof features, Trip>[] = [
    { id: 'stop', field: 'stopName', header: 'Stop', width: 200 },
    { id: 'arrival', field: 'arrivedAt', header: 'Arrived', width: 140, type: 'date' },
    { id: 'departure', field: 'departedAt', header: 'Departed', width: 140, type: 'date' },
    { id: 'duration', field: 'durationMinutes', header: 'Duration (min)', width: 130, type: 'number' },
    { id: 'status', field: 'stopStatus', header: 'Stop Status', width: 120, cell: stopStatusCell },
  ]

  async function loadTrips(vehicleId: string): Promise<Trip[]> {
    const res = await fetch(`/api/fleet/${vehicleId}/trips?limit=20`)
    if (!res.ok) throw new Error('Failed to load trips')
    return res.json()
  }
</script>

{#snippet vehicleDetail({ row }: { row: Vehicle })}
  <div class="trip-detail">
    <h4>Recent trips - {row.vehicleId}</h4>
    {#await loadTrips(row.vehicleId)}
      <p class="loading">Loading trip history...</p>
    {:then trips}
      <SvGrid data={trips} columns={tripColumns} rowHeight={32} />
    {:catch}
      <p class="error">Could not load trips. Try expanding again.</p>
    {/await}
  </div>
{/snippet}

<SvGrid
  {data}
  {columns}
  features={features}
  detail={vehicleDetail}
  rowHeight={36}
  virtualization={true}
  onApiReady={(a) => { api = a }}
/>
The {:catch} branch matters here. Trip history is a secondary request and network failures should degrade gracefully rather than crashing the detail panel.
Exception-first filtering
The most requested feature in any ops grid is "show me only what's broken." That means two things: a fast toggle to filter to exception rows only, and sensible default sort that puts the worst offenders at the top.
<script lang="ts">
  let showExceptionsOnly = $state(false)

  function toggleExceptions() {
    showExceptionsOnly = !showExceptionsOnly
    if (showExceptionsOnly) {
      // Surface offline vehicles, late deliveries, and long idle times
      api.setFilter('status', { operator: 'in', value: ['Offline', 'Idle'] })
      api.setSort('delay', 'desc')
    } else {
      api.clearAllFilters()
    }
  }

  function filterByRegion(region: string | null) {
    if (region) {
      api.setFilter('region', { operator: 'equals', value: region })
    } else {
      api.clearFilter('region')
    }
  }
</script>

<div class="toolbar">
  <button
    class="exceptions-toggle"
    class:active={showExceptionsOnly}
    onclick={toggleExceptions}
  >
    {showExceptionsOnly ? 'Show all' : 'Exceptions only'}
  </button>

  <select onchange={(e) => filterByRegion(e.currentTarget.value || null)}>
    <option value="">All regions</option>
    {#each regions as region}
      <option value={region.id}>{region.name}</option>
    {/each}
  </select>
</div>
The in filter operator on the status column is the right tool here - you want offline AND idle, not just one. Pairing it with a sort on delay descending means the most critical situation is always row one when the filter is active.
Running server-side for large fleets
A national fleet with 5000+ vehicles can't run client-side. Set up server-side data with createServerDataSource and filter by depot or region at the API level, pushing live updates only for the vehicles currently in the visible page.
<script lang="ts">
  import SvGrid, { createServerDataSource } from '@svgrid/grid'

  let depotId = $state<string | null>(null)

  const ds = createServerDataSource({
    fetch: async ({ page, pageSize, sort, filters }) => {
      const params = new URLSearchParams({
        page: String(page),
        size: String(pageSize),
        ...(depotId ? { depot: depotId } : {}),
        ...(sort.length ? { sortField: sort[0].field, sortDir: sort[0].dir } : {}),
      })
      for (const f of filters) {
        params.set(`filter_${f.field}`, f.value)
      }
      const res = await fetch(`/api/fleet/vehicles?${params}`)
      const json = await res.json()
      return { rows: json.vehicles, total: json.total }
    }
  })
</script>

<SvGrid
  data={ds}
  {columns}
  pageable
  sortable
  filterable
  rowHeight={36}
  onApiReady={(a) => { api = a }}
/>
With server-side paging you can push WebSocket updates scoped to the current depot or region - no point streaming telemetry for 4800 vehicles when the dispatcher is looking at a 200-vehicle regional view.
Stale GPS as a data quality signal
One thing that catches people off guard: a vehicle showing "Moving" with a 20-minute-old GPS timestamp isn't moving - the GPS unit is failing or the vehicle drove into a tunnel. The isStale check in the lastSeen column above flags this visually. You can go further and add a filter preset for "stale GPS" that combines a timestamp age filter with status != Offline. Dispatchers often don't know to look for this, but once they see it highlighted they start relying on it heavily.
The fleet tracking grid is one of those cases where the data model is straightforward but the operational requirements shape almost every display decision. Exception-first layout, stale signal detection, and lazy trip history aren't nice-to-haves - they're what makes the difference between a grid that dispatchers keep open all day and one that gets replaced by a phone call.
Related reading
- Building a Real-Time Trading Grid in Svelte
- Building an IoT Sensor Dashboard in Svelte
- Building a SaaS Billing and Usage Table in Svelte
- Building a Project / Task Board with a Svelte Data Grid
- Building an Order Management Dashboard in Svelte
Tagged: Real-time data