Spreadsheet formulas
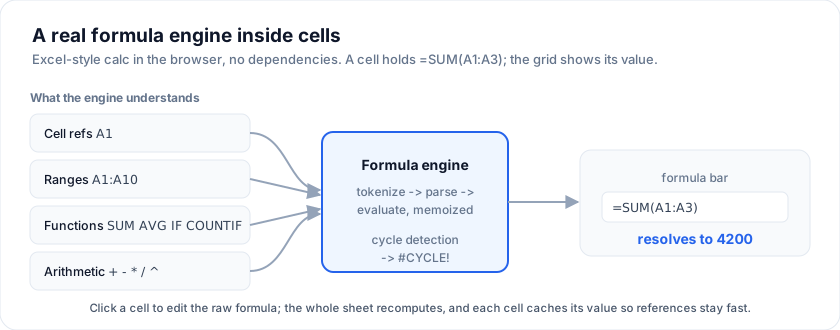
A minimal Excel-style formula engine that runs in the browser, with no
dependencies. Cells can hold either a literal value (number, string,
boolean) or a formula starting with =. When the formula resolves
against the sheet, the cell shows the computed value; when you click
the cell, the formula bar shows the source.
Useful for budgets, scorecards, cascading totals, conditional reports, lightweight planning - anything that needs in-cell calc without bundling a full spreadsheet engine like HyperFormula.
Open the live example: Spreadsheet + formulas (Spreadsheet)
What's supported
| Category | Examples |
|---|---|
| Cell refs | A1, B2, AA10, $C$3 (absolute = relative here) |
| Ranges | A1:A10, B2:D5 |
| Arithmetic | + - * / ^ % (unary -) |
| Comparison | = <> < > <= >= |
| String concat | & |
| Functions | SUM, AVG/AVERAGE, MIN, MAX, COUNT, COUNTA, COUNTIF |
IF, AND, OR, NOT |
|
ROUND, ABS |
|
LEN, LEFT, RIGHT, UPPER, LOWER, CONCAT |
|
TODAY |
|
| Literals | numbers (1.5, -3), strings ("hello"), booleans (TRUE/FALSE) |
Error codes
The engine produces the same error vocabulary as Excel:
| Code | When |
|---|---|
#REF! |
Cell reference points outside the sheet |
#CYCLE! |
Circular dependency |
#DIV/0! |
Division by zero |
#VALUE! |
Type mismatch (e.g. ="abc"+1) |
#NAME? |
Unknown function name |
#PARSE! |
Syntax error |
Complete drop-in example
A self-contained budget sheet. The engine code (≈ 280 lines) is the same one the demo ships - copy it verbatim, or read the full source in demo 83.
The grid shows the computed values; a formula bar above lets the user inspect or edit the raw formula behind the active cell.
<script lang="ts">
  import {
    SvGrid,
    tableFeatures,
    rowSortingFeature,
    renderSnippet,
    type ColumnDef,
  } from '@svgrid/grid'

  // ─────────────────── ENGINE ───────────────────
  type CellVal = string | number | boolean | { error: string }
  type Sheet = string[][]

  function isError(v: CellVal): v is { error: string } {
    return typeof v === 'object' && v !== null && 'error' in v
  }

  function colToLetters(c: number): string {
    let n = c, s = ''
    while (n >= 0) { s = String.fromCharCode(65 + (n % 26)) + s; n = Math.floor(n / 26) - 1 }
    return s
  }
  function lettersToCol(l: string): number {
    let c = 0
    for (const ch of l.toUpperCase()) c = c * 26 + (ch.charCodeAt(0) - 64)
    return c - 1
  }
  function parseRef(ref: string): { row: number; col: number } | null {
    const m = ref.replace(/\$/g, '').match(/^([A-Z]+)(\d+)$/i)
    return m ? { row: parseInt(m[2]!, 10) - 1, col: lettersToCol(m[1]!) } : null
  }

  // (tokenize / parse / evaluate omitted for brevity - copy from demo 83)
  // Below is the public surface you actually call.

  declare function tokenize(formula: string): unknown[]
  declare function parse(tokens: unknown[]): unknown
  declare function evaluate(ast: unknown, resolve: (r: number, c: number) => CellVal): CellVal

  function computeSheet(sheet: Sheet): CellVal[][] {
    const rowsN = sheet.length
    const colsN = sheet[0]?.length ?? 0
    const computed: (CellVal | undefined)[][] =
      Array.from({ length: rowsN }, () => new Array(colsN))
    const visiting: boolean[][] =
      Array.from({ length: rowsN }, () => new Array(colsN).fill(false))

    function resolve(r: number, c: number): CellVal {
      if (r < 0 || r >= rowsN || c < 0 || c >= colsN) return { error: '#REF!' }
      if (computed[r]![c] !== undefined) return computed[r]![c]!
      if (visiting[r]![c]) return { error: '#CYCLE!' }
      visiting[r]![c] = true
      const raw = (sheet[r]![c] ?? '').trim()
      let value: CellVal
      if (raw === '') value = ''
      else if (raw.startsWith('=')) {
        try { value = evaluate(parse(tokenize(raw.slice(1))), resolve) }
        catch (e) {
          const msg = e instanceof Error ? e.message : '#ERR!'
          value = { error: msg.startsWith('#') ? msg : '#PARSE!' }
        }
      } else {
        const n = Number(raw)
        value = Number.isFinite(n) ? n : raw
      }
      visiting[r]![c] = false
      computed[r]![c] = value
      return value
    }
    for (let r = 0; r < rowsN; r++) for (let c = 0; c < colsN; c++) resolve(r, c)
    return computed.map((row) => row.map((v) => v ?? '')) as CellVal[][]
  }

  // ─────────────────── DEMO ───────────────────
  // raw[row][col] = the text the user typed (formula or literal).
  let raw = $state<Sheet>([
    ['Item',     'Cost', 'Qty', 'Subtotal',         'Total'],
    ['Domain',   '12.99','3',   '=B2*C2',           '=ROUND(D2*1.08,2)'],
    ['Hosting',  '49',   '12',  '=B3*C3',           '=ROUND(D3*1.08,2)'],
    ['SSL',      '85',   '1',   '=B4*C4',           '=ROUND(D4*1.08,2)'],
    ['TOTALS',   '',     '',    '=SUM(D2:D4)',      '=SUM(E2:E4)'],
    ['Status',   '',     '',    '',                 '=IF(E5>500,"REVIEW","OK")'],
  ])
  const computed = $derived(computeSheet(raw))

  let activeRow = $state<number | null>(null)
  let activeCol = $state<number | null>(null)
  const activeRaw = $derived(
    activeRow != null && activeCol != null ? raw[activeRow]?.[activeCol] ?? '' : '',
  )
  let formulaInput = $state('')
  $effect(() => { formulaInput = activeRaw })

  function commit() {
    if (activeRow == null || activeCol == null) return
    const next = raw.map((row) => row.slice())
    next[activeRow]![activeCol] = formulaInput
    raw = next
  }

  function formatValue(v: CellVal): string {
    if (isError(v)) return v.error
    if (typeof v === 'number') return Number.isInteger(v) ? String(v) : v.toFixed(2)
    if (typeof v === 'boolean') return v ? 'TRUE' : 'FALSE'
    return String(v)
  }

  // SvGrid columns - one per spreadsheet column. Each row is a SheetRow.
  type SheetRow = { rowIndex: number; cells: CellVal[] }
  const gridRows = $derived<SheetRow[]>(
    computed.slice(1).map((cells, i) => ({ rowIndex: i + 1, cells })),
  )
  const headerCells = $derived(computed[0] ?? [])

  const features = tableFeatures({ rowSortingFeature })
  const columns = $derived<ColumnDef<typeof features, SheetRow>[]>(
    Array.from({ length: 5 }, (_, c) => ({
      id: colToLetters(c),
      header: `${colToLetters(c)} · ${formatValue(headerCells[c] ?? '')}`,
      width: c === 0 ? 160 : 130,
      editable: false,
      cell: (ctx) => renderSnippet(SheetCell, { row: ctx.row.original, col: c }),
    })),
  )
</script>

{#snippet SheetCell(props: { row: SheetRow; col: number })}
  {@const r = props.row.rowIndex}
  {@const c = props.col}
  {@const v = props.row.cells[c] ?? ''}
  {@const active = activeRow === r && activeCol === c}
  <span
    onclick={() => { activeRow = r; activeCol = c }}
    style="display: inline-block; width: 100%; cursor: pointer;
           {active ? 'background: rgba(99,102,241,0.10); box-shadow: inset 0 0 0 2px #6366f1;' : ''}
           {isError(v) ? 'color: #dc2626; font-family: ui-monospace, Menlo, monospace;' : ''}"
    title={raw[r]?.[c] ?? ''}
  >{formatValue(v)}</span>
{/snippet}

<section style="display: flex; flex-direction: column; gap: 10px; height: 100%;">
  <!-- Formula bar -->
  <div style="display: flex; align-items: center; gap: 8px; border: 1px solid #cbd5e1; border-radius: 8px;">
    <span style="background: #f1f5f9; padding: 8px 12px; font-family: ui-monospace, Menlo, monospace; font-weight: 700; min-width: 64px; text-align: center;">
      {activeRow != null && activeCol != null ? `${colToLetters(activeCol)}${activeRow + 1}` : '-'}
    </span>
    <input
      type="text"
      bind:value={formulaInput}
      placeholder="Click a cell, then type =SUM(D2:D4) here…"
      onkeydown={(e) => { if (e.key === 'Enter') { e.preventDefault(); commit() } }}
      onblur={commit}
      style="flex: 1; border: 0; outline: none; font-family: ui-monospace, Menlo, monospace; padding: 7px 8px;"
    />
  </div>

  <div style="flex: 1; min-height: 0;">
    <SvGrid
      data={gridRows}
      columns={columns}
      features={features}
      enableInlineEditing={false}
      enableCellSelection={false}
      showRowNumbers={true}
      rowNumberWidth={48}
      rowHeight={32}
      containerHeight="100%"
    />
  </div>
</section>
The
tokenize/parse/evaluatefunctions are declared but not defined inline above - they are ~ 200 lines of TypeScript. Copy them from the demo source which is fully self-contained.
How the recompute works
computeSheet(raw) runs every time the raw sheet changes. It walks
every cell once, lazily resolving references:
- Literal - try
Number(raw), fall back to the string. - Formula - tokenize, parse to an AST, evaluate against the resolver.
- Memoize - once a cell is computed, its value is cached so downstream cells don't re-parse the same formula.
- Cycle detection - a
visitingflag per cell. If a resolver tries to read a cell that's currently being computed, it returns#CYCLE!instead of looping forever.
The $derived wrapper (computed = $derived(computeSheet(raw)))
re-runs the whole sheet whenever any cell changes. For sheets under
~ 10 000 cells this is fast - the demo's 16 × 8 sheet recomputes in
under a millisecond.
For very large sheets, switch to incremental recompute by tracking which cells depend on which (build a forward edges graph during the first pass) and recomputing only the affected sub-DAG. The shape of the resolver doesn't change.
Try these formulas
In the formula bar of the demo, click a cell and type:
=SUM(D2:D4)               // sum a range
=AVG(E2:E4)               // average
=IF(E5>500,"REVIEW","OK") // conditional text
=COUNTIF(F2:F4,"REVIEW")  // count matches
=B2*C2&" units"           // arithmetic + string concat
=ROUND(E2/E$5*100,1)      // percentage with rounding
=TODAY()                  // today's date as YYYY-MM-DD
Each commits immediately on Enter and recomputes the whole sheet.
Bridging to xlsx export
The engine stores raw formulas as text. When you export to xlsx via
@svgrid/enterprise, you have two choices:
- Export computed values - default. The xlsx receives numbers and strings, Excel sees them as values.
- Export formulas - mark formula cells with a leading
=in the exported value. Excel parses them and recomputes on open. Useful when the recipient wants to drill into the math.
Both modes preserve cell formatting (currency, dates) you set on the columns.
Limitations & when to reach for HyperFormula
The bundled engine intentionally covers ~80% of common spreadsheet formulas. It does NOT support:
- VLOOKUP / INDEX / MATCH (planned)
- Volatile functions beyond
TODAY()(NOW,RAND,RANDBETWEEN) - Array formulas
- Named ranges
- 3-D references across multiple sheets
If you need full Excel parity, integrate HyperFormula - it's a 600 KB add-on that drops in alongside SvGrid. Reach for it only when you actually need it; the bundled engine is < 5 KB minified.
More examples
Blank sheet - just type
An empty Excel-style sheet on a plain
Open the live example: Blank sheet - just type (Spreadsheet)
Freeze panes
The Excel Freeze Panes corner on a plain
Open the live example: Freeze panes (Spreadsheet)
Data validation (dropdowns)
Excel Data Validation on a plain
Open the live example: Data validation (dropdowns) (Spreadsheet)
Format Cells
The Excel Home -> Number experience: select a range and apply a display format - Currency, Percent, Thousands, Number, Date, or General - and only the rendering changes; the stored value and every formula are untouched. HyperFormula keeps Gross profit, Margin and the Total column live, so a computed % formats exactly like a typed number.
Open the live example: Format Cells (Spreadsheet)
Financial model (amortization)
A real analyst model on the sheet: three blue INPUT cells (Principal, APR, Term) drive a full 360-month amortization schedule built entirely from formulas - PMT for the fixed payment, then per-period interest / principal / running balance that each reference the row above. Change an input and all 360 rows plus the summary recompute instantly. Blue = you type, black = computed.
Open the live example: Financial model (amortization) (Spreadsheet)
Dashboard sheet
A spreadsheet that reads like an Excel dashboard: each channel row carries an inline SVG trend sparkline and an eight-week heatmap shaded by volume. Total and Avg are live =SUM / =AVERAGE formulas - edit any weekly cell and the sparkline reshapes, the heatmap re-shades, and the totals update at once. Sparklines are a per-column custom cell; the heatmap is value-driven cellClass.
Open the live example: Dashboard sheet (Spreadsheet)
Chart a spreadsheet
A live formula sheet wired to the built-in Chart panel: edit a Units or Revenue cell and the chart redraws. Customize it in-panel - change Type, swap Group by / Split by / Value, aggregate, Stack, or add data labels.
Per-cell custom borders (KPI)
Editable KPI scorecard. spreadsheetLayout paints HOT-style per-edge custom borders via an absolute-positioned overlay (no border-collapse conflicts). Edit any quarter or target - the borders re-derive: green double = beat target, blue solid = hit, amber dotted = near miss, red dashed = bad miss; row champion gets a colored full frame.
Open the live example: Per-cell custom borders (KPI) (Spreadsheet)
See also
- Demo 83 - Spreadsheet + formulas - the full engine source
- Demo 27 - Spreadsheet + Ribbon bar - bold / colour / format ribbon
- Demo 18 - Cascade editing - the alternative when you want JS-driven recompute instead of formulas
- Export and print - xlsx export for the computed sheet
Live examples
- Spreadsheet + formulas - Real formula engine inside the grid: cell refs (A1), ranges (A1:A10), SUM / AVG / IF / COUNTIF / ROUND, arithmetic, string concat, cycle detection.
- Blank sheet - just type - An empty Excel-style sheet on a plain <SvGrid>: column-letter headers (A..Z), a built-in 1..N row gutter, a name box + formula bar with a browsable function picker, gridlines, range selection and a fill handle. A real HyperFormula engine underneath: type a literal or a formula like =SUM(B2:D2) / =IF(...) and every dependent cell recalculates live. Drag a row or column border to resize; right-click for Cut / Copy / Paste / Clear.
- Freeze panes - The Excel Freeze Panes corner on a plain <SvGrid>: the Account and Owner columns stay pinned while you scroll across a full year of months, and the sticky column-letter + row-number headers stay put as you scroll down. HyperFormula keeps each row total (column O) and the bottom Total row live as you edit any month. Pinning those two columns is one prop: initialColumnPinning.
- Data validation (dropdowns) - Excel Data Validation on a plain <SvGrid>: Status / Priority / Owner / Sprint columns are list-constrained (double-click for a dropdown), and Estimate must be a whole number 0-40. Four cells arrive invalid and light up red with the reason as a tooltip; fix one and it clears live. Dropdowns are editorType:list + editorOptions; the flag is the declarative validate() hook.
- Format Cells - The Excel Home -> Number experience: select a range and apply a display format - Currency, Percent, Thousands, Number, Date, or General - and only the rendering changes; the stored value and every formula are untouched. HyperFormula keeps Gross profit, Margin and the Total column live, so a computed % formats exactly like a typed number.
- Financial model (amortization) - A real analyst model on the sheet: three blue INPUT cells (Principal, APR, Term) drive a full 360-month amortization schedule built entirely from formulas - PMT for the fixed payment, then per-period interest / principal / running balance that each reference the row above. Change an input and all 360 rows plus the summary recompute instantly. Blue = you type, black = computed.
- Dashboard sheet - A spreadsheet that reads like an Excel dashboard: each channel row carries an inline SVG trend sparkline and an eight-week heatmap shaded by volume. Total and Avg are live =SUM / =AVERAGE formulas - edit any weekly cell and the sparkline reshapes, the heatmap re-shades, and the totals update at once. Sparklines are a per-column custom cell; the heatmap is value-driven cellClass.
- Chart a spreadsheet - A live formula sheet wired to the built-in Chart panel: edit a Units or Revenue cell and the chart redraws. Customize it in-panel - change Type, swap Group by / Split by / Value, aggregate, Stack, or add data labels.
- Per-cell custom borders (KPI) - Editable KPI scorecard. spreadsheetLayout paints spreadsheet-style per-edge custom borders via an absolute-positioned overlay (no border-collapse conflicts). Edit any quarter or target - the borders re-derive: green double = beat target, blue solid = hit, amber dotted = near miss, red dashed = bad miss; row champion gets a colored full frame.
- Spreadsheet + Ribbon bar - Excel-style Ribbon UI driving the grid via SvGridApi: cell formatting (bold, color, number format), insert/delete row, sort, live SUM/AVG/COUNT.
- Cascade editing - Spreadsheet invoice: editing qty / price / discount cascades into line totals.
Related articles
- A Fill Handle (Drag to Fill) in SvGrid - Build a working spreadsheet-style fill handle on top of SvGrid's cell selection and editing - pointer tracking, range highlighting, series fill, and undo/redo integration all covered.
- Pivot Tables in Svelte - Summarize Data Without a Spreadsheet - Run a cross-tab pivot directly inside your Svelte app using @svgrid/enterprise createPivotModel - no Excel, no server-side aggregation, no stale exports.
- Spreadsheet-Style Cell Range Selection in SvGrid - How to enable drag-to-select cell ranges, read live selection state, and build a status-bar footer that sums and averages the selected values.