Spreadsheet-Style Cell Range Selection in SvGrid
How to enable drag-to-select cell ranges, read live selection state, and build a status-bar footer that sums and averages the selected values.
Row selection is the default in most data grids, and for numeric data it is usually the wrong default. When a user drags across six cells in a budget table, they want the sum of those six cells. Highlighting six whole rows is not useful - it is visual noise.
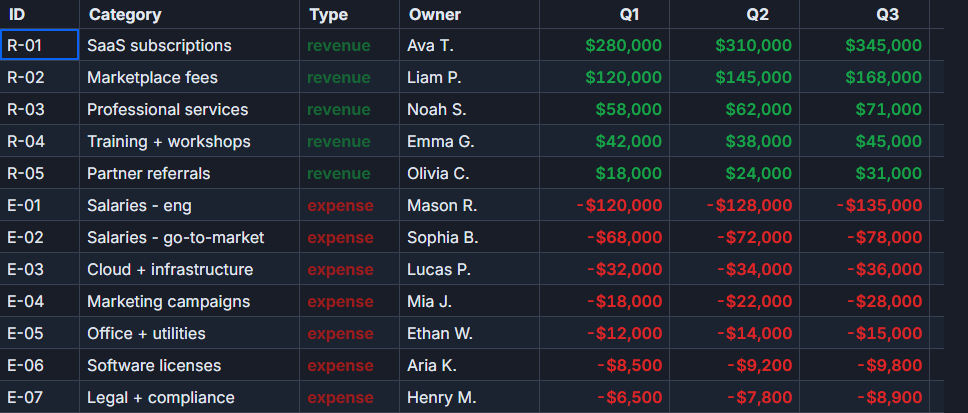
SvGrid ships cell range selection as a first-class feature behind a single prop. This post covers enabling it, reading the live selection state, and building the status-bar footer that most spreadsheet users expect.
Why row selection falls short for numeric data
Consider a monthly cloud spend table: five cost categories, twelve month columns, sixty numeric cells. A finance manager wants to know what Q2 Compute costs. With row selection, she selects the Compute row, sees the whole row highlighted, and still has to manually sum six cells. With range selection, she drags from Jan to Jun on the Compute row and a status bar tells her the sum instantly.
The interaction model is different enough that mixing the two in the same view is rarely a good idea. SvGrid enforces this: if you pass rowSelectionFeature to tableFeatures and also set rangeSelection={true}, the checkboxes render but drag selection is disabled. Pick one mode per view.
The data shape
The example throughout this post uses a simple budget dataset. Keeping the types explicit matters because api.getSelected() returns unknown values and you need to filter out string columns before computing aggregates.
// budget-data.ts
export type BudgetRow = {
  id: string
  category: string
  jan: number; feb: number; mar: number; apr: number
  may: number; jun: number; jul: number; aug: number
  sep: number; oct: number; nov: number; dec: number
}

export const MONTHS = [
  'jan', 'feb', 'mar', 'apr', 'may', 'jun',
  'jul', 'aug', 'sep', 'oct', 'nov', 'dec',
] as const
export type MonthKey = typeof MONTHS[number]

export const rows: BudgetRow[] = [
  { id: 'r1', category: 'Compute',    jan: 1200, feb: 1180, mar: 1350, apr: 1400, may: 1320, jun: 1290, jul: 1410, aug: 1380, sep: 1250, oct: 1300, nov: 1450, dec: 1500 },
  { id: 'r2', category: 'Storage',    jan:  430, feb:  445, mar:  460, apr:  470, may:  455, jun:  480, jul:  490, aug:  505, sep:  495, oct:  510, nov:  520, dec:  535 },
  { id: 'r3', category: 'Networking', jan:  210, feb:  215, mar:  230, apr:  225, may:  220, jun:  235, jul:  240, aug:  250, sep:  245, oct:  255, nov:  260, dec:  270 },
  { id: 'r4', category: 'Licenses',   jan:  900, feb:  900, mar:  900, apr:  900, may:  900, jun:  900, jul:  900, aug:  900, sep:  900, oct:  900, nov:  900, dec:  900 },
  { id: 'r5', category: 'Support',    jan:  320, feb:  320, mar:  340, apr:  340, may:  330, jun:  330, jul:  350, aug:  350, sep:  360, oct:  360, nov:  370, dec:  380 },
]
Each row has a stable id string. SvGrid uses this as the row key both for internal tracking and for programmatic selection via api.selectCells(startRowId, startColId, endRowId, endColId).
Wiring up the grid and the status bar
The component below enables range selection, subscribes to selection changes, and renders a live footer with count, sum, and average. The interesting parts are highlighted in the comments.
<script lang="ts">
  import {
    SvGrid,
    tableFeatures,
    rowSortingFeature,
    columnFilteringFeature,
    type ColumnDef,
    type SvGridApi,
  } from '@svgrid/grid'
  import { rows, MONTHS, type BudgetRow } from './budget-data'

  const features = tableFeatures({ rowSortingFeature, columnFilteringFeature })

  const fmt = new Intl.NumberFormat('en-US', {
    style: 'currency',
    currency: 'USD',
    maximumFractionDigits: 0,
  })

  const columns: ColumnDef<typeof features, BudgetRow>[] = [
    {
      field: 'category',
      header: 'Category',
      width: 130,
      editable: false,
      pinned: 'left',
    },
    ...MONTHS.map<ColumnDef<typeof features, BudgetRow>>((m) => ({
      field: m,
      header: m.charAt(0).toUpperCase() + m.slice(1),
      width: 88,
      align: 'right' as const,
      editorType: 'number' as const,
      format: { type: 'currency' as const, currency: 'USD' },
    })),
  ]

  type Stats = { count: number; sum: number; avg: number }
  let stats = $state<Stats | null>(null)
  let api = $state<SvGridApi<typeof features, BudgetRow> | null>(null)

  function onApiReady(ready: SvGridApi<typeof features, BudgetRow>) {
    api = ready

    // subscribeSvGrid fires on every internal state change, including
    // each pointer-move event during a drag. Keep this callback fast.
    api.subscribeSvGrid(() => {
      const cells = api!.getSelected()
      const nums = cells
        .filter((c) => typeof c.value === 'number')
        .map((c) => c.value as number)

      if (nums.length === 0) {
        stats = null
        return
      }

      const sum = nums.reduce((a, b) => a + b, 0)
      stats = { count: nums.length, sum, avg: sum / nums.length }
    })
  }
</script>

<div class="wrap">
  <SvGrid
    {features}
    {columns}
    data={rows}
    rowIdField="id"
    rangeSelection={true}
    {onApiReady}
    height={280}
  />

  <div class="status-bar" class:hidden={!stats}>
    {#if stats}
      <span>Count: {stats.count}</span>
      <span>Sum: {fmt.format(stats.sum)}</span>
      <span>Average: {fmt.format(stats.avg)}</span>
    {/if}
  </div>
</div>

<style>
  .wrap {
    display: flex;
    flex-direction: column;
    font-family: system-ui, sans-serif;
    font-size: 13px;
  }
  .status-bar {
    display: flex;
    gap: 24px;
    padding: 4px 12px;
    background: var(--sg-accent, #1a56db);
    color: #fff;
    font-variant-numeric: tabular-nums;
    border-radius: 0 0 6px 6px;
    min-height: 26px;
    transition: opacity 0.1s;
  }
  .status-bar.hidden {
    opacity: 0;
  }
</style>
Three things drive the whole feature:
rangeSelection={true}on the<SvGrid>element switches the interaction mode. Nothing else needs to change in the column definitions.api.subscribeSvGrid(callback)is the correct subscription mechanism. Do not pollapi.getSelected()on a timer - the subscriber fires on every internal transition including mid-drag pointer moves, so the status bar stays live during a drag gesture.typeof c.value === 'number'guards the aggregate.api.getSelected()returns every cell in the rectangular selection, including the pinnedcategorycolumn if the user drags left far enough. The string values will break a numeric sum, so filter explicitly.
How the selection rectangle is tracked
SvGrid maintains two internal pointers: the anchor cell (where the pointer went down) and the focus cell (where the pointer currently is, or where the keyboard last moved to). The selection is the rectangle those two corners define.
Every pointermove event updates the focus pointer and schedules a re-render of the highlight overlay. Keyboard extension works the same way - Shift+Arrow, Shift+Click, and Ctrl+Shift+End all move the focus pointer through the same code path, so you get full keyboard selection with no additional configuration.
api.getSelected() materialises that rectangle into a flat CellData[] array. The order is row-major: all selected cells from the first row, then all from the second row, and so on. Values come from the current rendered data, not the original source array. If the grid is sorted or filtered, getSelected() reflects what is actually displayed.
Programmatic selection and clipboard export
There are two common follow-on needs once range selection is working: selecting a range without user interaction, and copying the selection to the clipboard.
Pre-selecting a range on mount is straightforward. Call api.selectCells inside onApiReady after any initial data load:
function onApiReady(api: SvGridApi<typeof features, BudgetRow>) {
  // Pre-select Q1 for all categories on mount
  api.selectCells('r1', 'jan', 'r5', 'mar')

  // Clipboard: Ctrl+C copies selected range as TSV for Excel/Sheets paste
  window.addEventListener('keydown', (e) => {
    if ((e.ctrlKey || e.metaKey) && e.key === 'c') {
      const cells = api.getSelected()
      if (cells.length === 0) return

      // Group cells into rows using the rowId field
      const rowMap = new Map<string, string[]>()
      for (const cell of cells) {
        const existing = rowMap.get(cell.rowId) ?? []
        existing.push(String(cell.value ?? ''))
        rowMap.set(cell.rowId, existing)
      }

      const tsv = [...rowMap.values()]
        .map((vals) => vals.join('\t'))
        .join('\n')

      navigator.clipboard.writeText(tsv)
    }
  })
}
SvGrid does not ship a built-in clipboard handler for range copy. That is intentional - different apps want different formats (TSV, JSON, formatted currency strings) and different keyboard bindings. The raw getSelected() API gives you everything you need to build exactly the behavior your users expect.
Pagination and filtered data
Range selection is scoped to displayed rows. If the grid is paginated to 20 rows per page and the user selects all, api.getSelected() returns cells from the 20 displayed rows only - not from all pages.
If you need cross-page aggregates, compute them from api.getData() separately and compare row ids against the selected set. Do not rely on getSelected() to cross page or filter boundaries. For most financial and analytics use cases, page-scoped selection is exactly what users want - they see a range, they select it, they get the aggregate for what is visible. Cross-page aggregation is a different feature with a different UI contract.
Keyboard navigation requirements
Shift+Arrow selection extension requires the grid container to hold focus. If the user clicks a button outside the grid and then tries to extend the selection with the keyboard, nothing will happen until the grid receives focus again. If you drive selection programmatically and then want keyboard extension to work, call api.setActiveCell(rowId, colId) first to restore focus state before setting the selection range.
Related reading
- A Fill Handle (Drag to Fill) in SvGrid
- Row Selection and Clipboard Copy-Paste in SvGrid
- Bulk Operations on Selected Rows in SvGrid
- Bundle Size of Svelte Data Grids - How to Compare
- Saved Views - Persist Grid Layout and Filters
Tagged: Selection