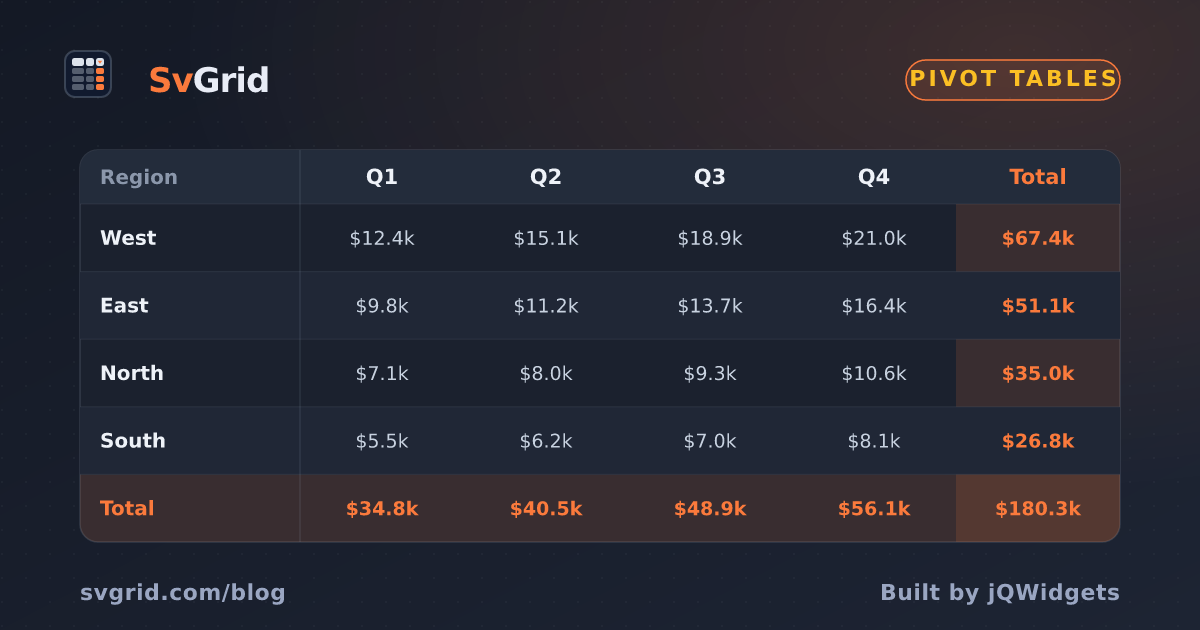
Pivot Tables in Svelte - Summarize Data Without a Spreadsheet
Run a cross-tab pivot directly inside your Svelte app using @svgrid/enterprise createPivotModel - no Excel, no server-side aggregation, no stale exports.
The request is always the same: "Can you break revenue down by region and quarter?" The easiest answer is to export a CSV, open Excel, and drag fields around for two minutes. The better answer is a pivot table that recomputes every time the data changes, lives inside the app, and never requires opening a spreadsheet.
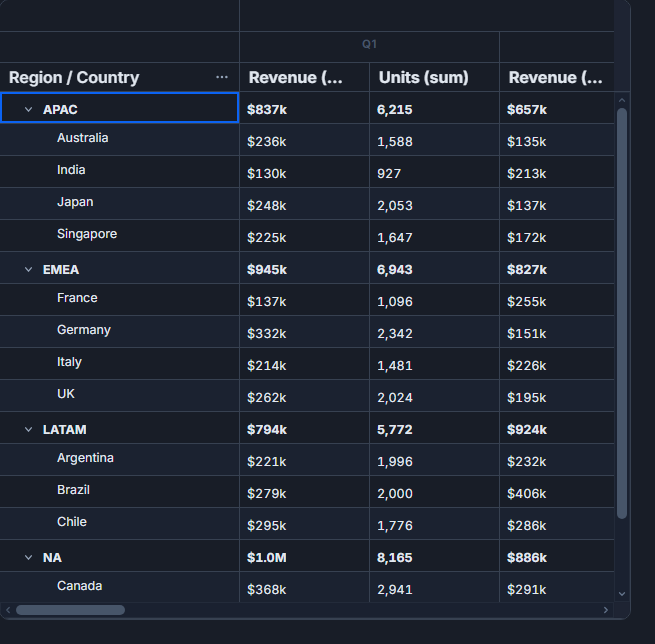
@svgrid/enterprise ships createPivotModel for exactly this. It takes a flat array of fact rows, a list of row fields and column fields, one or more aggregation configs, and returns pivot rows and generated column keys that you hand directly to SvGrid. The whole thing runs synchronously in the browser. For datasets under ~100,000 rows, the latency is imperceptible.
What the data looks like
Pivot models are easiest to reason about when you hold the raw shape in your head first. The source data here is a sales fact table: one row per transaction, with region, quarter, channel, revenue, and units on each row.
// types.ts
export type Region  = 'AMER' | 'EMEA' | 'APAC'
export type Quarter = 'Q1' | 'Q2' | 'Q3' | 'Q4'
export type Channel = 'Online' | 'Retail' | 'Wholesale'

export type SalesFact = {
  id:      number
  region:  Region
  quarter: Quarter
  channel: Channel
  revenue: number
  units:   number
}

// A deterministic generator so everyone on the team sees the same numbers.
// Replace with fetch() or createServerDataSource in production.
let prng = 0xDA7A1001 >>> 0
function rnd(): number {
  prng = (prng * 1664525 + 1013904223) >>> 0
  return prng / 0xffffffff
}
function pick<T>(arr: readonly T[]): T {
  return arr[Math.floor(rnd() * arr.length)]!
}

export function seedFacts(n = 2000): SalesFact[] {
  const regions:   readonly Region[]  = ['AMER', 'EMEA', 'APAC']
  const quarters:  readonly Quarter[] = ['Q1', 'Q2', 'Q3', 'Q4']
  const channels:  readonly Channel[] = ['Online', 'Retail', 'Wholesale']

  return Array.from({ length: n }, (_, i) => ({
    id:      i + 1,
    region:  pick(regions),
    quarter: pick(quarters),
    channel: pick(channels),
    revenue: Math.round(1500 + rnd() * 38_500),
    units:   Math.round(1 + rnd() * 99),
  }))
}
The goal: one row per region in the output, one column per quarter, each cell showing the sum of revenue for that combination. The grand total column shows the row sum across all quarters.
Building the pivot component
createPivotModel does three things: collects unique values for each column field (to generate column keys), groups fact rows by the cross-product of row fields and column fields, then runs the aggregation function over each bucket.
The returned object has two properties you care about: rows (the pivot rows, one per unique combination of row-field values) and colKeys (a sorted string array like ["Q1 Revenue", "Q2 Revenue", "Q3 Revenue", "Q4 Revenue"]). Column definitions are built from colKeys at the same time as the model, so they are always in sync.
<script lang="ts">
  import {
    SvGrid,
    tableFeatures,
    rowSortingFeature,
    type ColumnDef,
    type SvGridApi,
  } from '@svgrid/grid'
  import {
    createPivotModel,
    filterCollapsedPivotRows,
    installEnterprise,
    setLicenseKey,
    type PivotRow,
    type PivotValueConfig,
  } from '@svgrid/enterprise'

  import { seedFacts, type SalesFact } from './types'

  setLicenseKey('YOUR-LICENSE-KEY')
  installEnterprise()  // must be module-scope, not inside onMount

  // --- source data ---------------------------------------------------
  const facts: SalesFact[] = seedFacts(2000)

  // --- aggregation config --------------------------------------------
  const usd = new Intl.NumberFormat('en-US', {
    style: 'currency',
    currency: 'USD',
    notation: 'compact',
    maximumFractionDigits: 1,
  })

  const valueConfigs: PivotValueConfig[] = [
    {
      field:       'revenue',
      aggFunc:     'sum',
      headerName:  'Revenue',
      formatValue: (v: number) => usd.format(v),
    },
  ]

  // --- pivot model ---------------------------------------------------
  const pivot = createPivotModel({
    data:        facts,
    rowFields:   ['region'],
    colFields:   ['quarter'],
    valueFields: valueConfigs,
    grandTotal:  true,
  })

  // --- column definitions derived from pivot output ------------------
  const columns: ColumnDef<PivotRow>[] = [
    {
      id:          'region',
      accessorKey: 'region',
      header:      'Region',
      size:        130,
      pinned:      'left',
    },
    ...pivot.colKeys.map((key) => ({
      id:          key,
      accessorKey: key,
      header:      key,
      size:        150,
      cell: (info: { getValue: () => unknown }) => info.getValue() ?? '-',
    })),
    {
      id:          'grandTotal',
      accessorKey: 'grandTotal',
      header:      'Total',
      size:        160,
      pinned:      'right',
    },
  ]

  // --- API -----------------------------------------------------------
  let api = $state<SvGridApi | undefined>(undefined)

  function onApiReady(ready: SvGridApi) {
    api = ready
    // Default: sort by grand total descending so the highest-revenue region comes first.
    ready.setSort('grandTotal', 'desc')
  }
</script>

<SvGrid
  features={tableFeatures([rowSortingFeature])}
  data={filterCollapsedPivotRows(pivot.rows)}
  {columns}
  rowId="rowKey"
  {onApiReady}
  style="height: 320px;"
/>
Two things trip people up on their first pass.
First: filterCollapsedPivotRows. Even when there is no expand-collapse hierarchy, createPivotModel appends internal bookkeeping rows to the array. Without the filter, a row with rowKey: '__meta__' appears at the bottom with blank cells. Always wrap pivot.rows in filterCollapsedPivotRows before passing to SvGrid.
Second: installEnterprise() at module scope. If you move it inside onMount, the first render runs with the community row model and silently produces an empty grid. No warning, just nothing. Put it at the top of <script>.
Adding a second column field
The configuration change is minimal - add 'channel' to colFields. The model now generates one key per unique (quarter, channel) combination. With 4 quarters and 3 channels that is 12 columns, which the column derivation handles without any changes on your side.
const pivot = createPivotModel({
  data:        facts,
  rowFields:   ['region'],
  colFields:   ['quarter', 'channel'],  // <-- two column dimensions
  valueFields: valueConfigs,
  grandTotal:  true,
})

// pivot.colKeys is now 12 entries:
// ["Q1 Online Revenue", "Q1 Retail Revenue", "Q1 Wholesale Revenue",
//  "Q2 Online Revenue", ..., "Q4 Wholesale Revenue"]
If you also want a second value field - say units alongside revenue - add a second entry to valueConfigs. The key count doubles again (12 quarter-channel combos x 2 values = 24 columns). This is where you start thinking about whether a flat cross-tab is the right UI versus a grouped row hierarchy. For interactive field selection, SvPivotDesigner from @svgrid/enterprise gives users a drag-and-drop panel to move fields between rows, columns, and values.
Filtering before aggregation vs. after
There is a distinction that matters in practice: filtering before aggregation changes the numbers; filtering after changes only which pivot rows are visible.
api.setFilter(...) on the grid runs after createPivotModel has already materialized its output. Filtering will hide region rows from view but will not re-aggregate the underlying facts. This is correct behavior if you want to show only AMER and EMEA - the sums are still based on all AMER and EMEA transactions.
If you want to exclude certain transactions from the sums themselves - for example, only count Online channel revenue - you pre-filter the facts array before calling createPivotModel:
// Pre-filter: only online transactions contribute to the aggregation.
const onlineFacts = facts.filter(f => f.channel === 'Online')

const pivot = createPivotModel({
  data:        onlineFacts,  // filtered subset
  rowFields:   ['region'],
  colFields:   ['quarter'],
  valueFields: valueConfigs,
  grandTotal:  true,
})

// Re-derive columns from the new pivot output.
const columns: ColumnDef<PivotRow>[] = [
  // ... same derivation as before
]
In a reactive Svelte component, the pattern is: declare pivot and columns with $derived, tie them to a reactive filter state, and both update together whenever the filter changes. SvGrid picks up the new data and columns references in the same render cycle.
Performance boundary
createPivotModel is synchronous and single-threaded. In benchmarks on a mid-range laptop, 50,000 rows across a 4x3 cross-tab (12 output cells per region) aggregate in under 30ms. At 200,000 rows, latency creeps past 100ms and you will start to feel it on filter interactions that trigger re-aggregation.
The practical ceiling for a comfortable client-side experience is around 100,000-150,000 fact rows, depending on how many cross-product dimensions you have. Beyond that, aggregate server-side and return pre-summarized pivot rows. The grid does not care whether data comes from createPivotModel or a custom fetch - as long as the row shape matches your column definitions, it renders the same way.
For very large datasets, createServerDataSource accepts a fetch callback that receives the current page, sort state, and filters. You can use that to call a server endpoint that returns already-aggregated pivot rows, then map the response to the same ColumnDef structure shown above.
When column keys change at runtime
If new data arrives with a quarter that did not exist in the original load - say Q1 2026 appears after a refresh - pivot.colKeys grows and a new column needs to appear in the grid. This only works if both pivot and columns are re-derived together. If you cache columns and only update data, the new column key will be present in every row object but missing from the column definitions, and SvGrid will silently ignore it.
The safe pattern: derive columns from pivot.colKeys in the same expression every time pivot is recomputed. In Svelte 5 runes that means a $derived block or a function call that returns both at once.
Related reading
- Grouping and Aggregation in a Svelte Data Grid
- Scheduling - Automate Exports and Reminders Without a Backend
- Evaluating SVAR Svelte DataGrid? What Changes if You Pick SvGrid
- Bundle Size of Svelte Data Grids - How to Compare
- Saved Views - Persist Grid Layout and Filters
Tagged: Aggregation