Grouping and Aggregation in a Svelte Data Grid
How to group rows by one or more columns and show per-group sums, averages, and counts using SvGrid's columnGroupingFeature - with real code and the edge cases that actually bite.
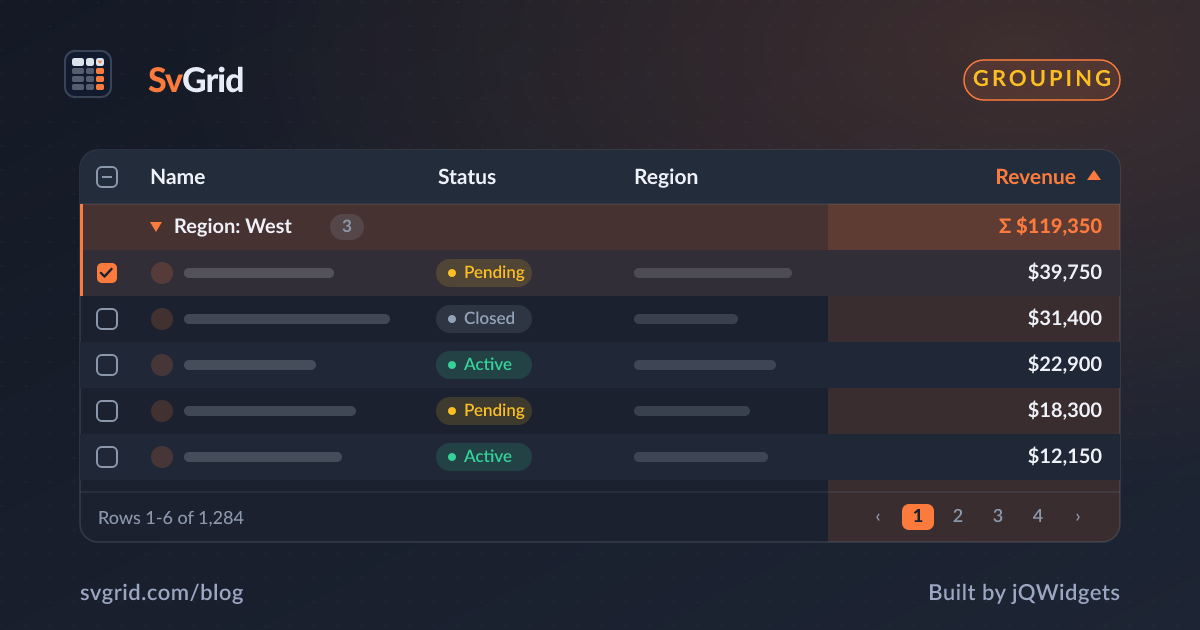
Row grouping is one of those features that sounds simple until you build it. You need a collapsible header row per group, an aggregate footer row per group, correct totals when filtering is active, expand/collapse state that survives a re-render, and multi-level nesting that does not blow up the virtual scroller. Most grids implement about 60% of that list. SvGrid's columnGroupingFeature handles all of it, and this post walks through exactly how to wire it up.

What you register and why it matters
SvGrid uses an explicit feature registration model. You only pull in what you need, and the bundler tree-shakes the rest. Grouping requires two features working together: columnGroupingFeature builds the grouped row model (header rows, leaf rows, footer rows), and rowExpandingFeature manages the collapse toggle state. Skip one of them and something silently breaks - more on that below.
import {
  tableFeatures,
  rowSortingFeature,
  columnFilteringFeature,
  columnGroupingFeature,
  rowExpandingFeature,
  type ColumnDef,
  type SvGridApi,
} from '@svgrid/grid'

// Register both grouping features together. rowExpandingFeature controls
// the expand/collapse toggle; columnGroupingFeature builds the row model.
const features = tableFeatures({
  rowSortingFeature,
  columnFilteringFeature,
  columnGroupingFeature,
  rowExpandingFeature,
})
The features object is passed to both the column definitions (for TypeScript inference) and to the <SvGrid> component. If you define columns without passing features to the type parameter, you lose autocomplete on aggregate, groupBy, and the header/footer cell overrides.
Declaring aggregations per column
Aggregation is declared at the column level, not the feature level. Each column independently specifies how its values roll up to a group footer. The built-in strategies are sum, avg, min, max, and count. If the column has a format config, the formatter runs on the aggregate output - so a sum on a currency column renders as $1,234,567, not a raw integer.
import { type ColumnDef } from '@svgrid/grid'

type Person = {
  id: number
  department: string
  country: string
  firstName: string
  lastName: string
  salary: number
  performance: number
}

const columns: ColumnDef<typeof features, Person>[] = [
  { id: 'department', field: 'department', header: 'Department', width: 160 },
  { id: 'country',    field: 'country',    header: 'Country',    width: 100 },
  { id: 'firstName',  field: 'firstName',  header: 'First',      width: 120 },
  { id: 'lastName',   field: 'lastName',   header: 'Last',       width: 120 },
  {
    id: 'salary',
    field: 'salary',
    header: 'Salary',
    width: 130,
    type: 'number',
    format: { type: 'currency', currency: 'USD', options: { maximumFractionDigits: 0 } },
    aggregate: 'sum',   // group footer shows sum, formatted as currency
  },
  {
    id: 'performance',
    field: 'performance',
    header: 'Perf',
    width: 80,
    type: 'number',
    aggregate: 'avg',   // group footer shows average score
  },
]
age is deliberately left without an aggregate - a sum of ages is meaningless here, and omitting it leaves the footer cell blank rather than rendering a nonsense number.
The full component with runtime group switching
Grouping key changes at runtime are a real requirement. A sales dashboard might let users toggle between "by region" and "by product line" without reloading the page. The api.setGroupBy(fields) call handles this - pass a full string array and the row model rebuilds synchronously.
<script lang="ts">
  import SvGrid from '@svgrid/grid'

  // features and columns defined as shown above
  const rows: Person[] = makePeople(500)

  let api = $state<SvGridApi<typeof features, Person> | null>(null)
  let activeGroup = $state<string[]>(['department'])

  function switchGroup(fields: string[]) {
    activeGroup = fields
    api?.setGroupBy(fields)
  }

  function handleApiReady(g: SvGridApi<typeof features, Person>) {
    api = g
    // Start with all groups collapsed so the user sees a clean summary view.
    g.collapseAllGroups()
  }
</script>

<div class="controls">
  <button onclick={() => switchGroup(['department'])}>By Department</button>
  <button onclick={() => switchGroup(['country'])}>By Country</button>
  <button onclick={() => switchGroup(['department', 'country'])}>Dept + Country</button>
  <button onclick={() => api?.expandAllGroups()}>Expand all</button>
  <button onclick={() => api?.collapseAllGroups()}>Collapse all</button>
</div>

<SvGrid
  data={rows}
  {columns}
  {features}
  groupBy={activeGroup}
  groupable
  sortable
  filterable
  showFilterRow={true}
  onApiReady={handleApiReady}
  style="height: 560px; width: 100%;"
/>
The groupBy prop accepts an array of field names. Two elements build a two-level hierarchy: rows nest under department, then under country within each department. Each level gets its own header row and its own aggregate footer row showing rolled-up totals for that sub-group. Collapse state is tracked independently per level, so you can have Engineering expanded with US collapsed and JP expanded inside it.
One subtle point: always pass the full fields array in a single setGroupBy call rather than chaining two calls. Calling api.setGroupBy(['department']) and then immediately api.setGroupBy(['department', 'country']) in two microtasks can produce a visible flicker at the intermediate single-level state. Build the array first, then call setGroupBy once.
How filtering and grouping interact
The row model pipeline runs in a fixed order: filter first, then group, then sort. api.setFilter(...) narrows the leaf rows, and then columnGroupingFeature regroups over what survives the filter. The group footer aggregates reflect the filtered set, not the total dataset.
That is the right behavior for most use cases - when a user filters to "country = US", they want group totals for US rows only. But occasionally you need unfiltered totals shown alongside filtered rows (a "grand total" row that never changes). The built-in pipeline does not support that directly. The practical answer is server-side pre-aggregation: compute the unfiltered totals on the server and inject them as a pinned footer row using api.applyTransaction.
Starting collapsed, editing live, and persisting state
Three patterns come up often enough to address directly.
Starting collapsed. Call api.collapseAllGroups() inside onApiReady. It fires once after the first render, so the initial view shows summary rows with no flash of expanded content.
Live edits updating aggregates. When an inline cell edit commits - whether via the built-in editor or api.startEditing() / api.stopEditing() - SvGrid invalidates the affected group's row model and recomputes the aggregate. The footer re-renders in the same frame. No extra code required.
Persisting expand/collapse state. Collapse state is part of the grid's state object. api.getState() returns it; api.setState(saved) restores it. If you store state in localStorage or a URL param, group collapse state comes along for free with the rest of the view state (sort, filter, column order).
The aggregation edge cases that actually matter
A few things behave in ways that are not obvious from the docs.
avg on an empty group returns NaN. A group with zero leaf rows after filtering has no values to average. The footer cell renders NaN unless you guard against it. A custom aggregateFn that returns null for empty groups - rendering as a blank cell - is usually the better choice.
count on a currency column formats as currency. If salary has format: { type: 'currency' } and you set aggregate: 'count', the group footer renders something like $71. That is technically correct (the formatter runs on the aggregate output), but you probably want just 71. Either add a separate dedicated count column without a format, or override the footer cell renderer with a custom snippet that bypasses formatting.
Non-numeric values in numeric aggregations. If a salary field contains "N/A" for some rows (from a bad import or a legacy API), sum and avg silently produce NaN for any group containing those rows. Parse and sanitize data before handing it to data, or write a custom aggregateFn that filters out non-finite values with Number.isFinite.
// Custom aggregateFn that skips non-finite values - safer than the default sum
{
  id: 'salary',
  field: 'salary',
  header: 'Salary',
  type: 'number',
  format: { type: 'currency', currency: 'USD', options: { maximumFractionDigits: 0 } },
  aggregateFn: (values: number[]) => {
    const finite = values.filter(Number.isFinite)
    return finite.length ? finite.reduce((a, b) => a + b, 0) : null
  },
}
When to reach for pivot instead
columnGroupingFeature is a row-grouping feature. It collapses rows and shows totals, but the column structure stays the same. If you need to pivot a value field across category values - turning unique department names into column headers with salary totals under each - that is a different problem handled by createPivotModel from @svgrid/enterprise. The two are complementary: pivot is for cross-tabulation, grouping is for hierarchical drill-down.
For most analytical dashboards the grouping feature covers 80% of what users actually do: group by a categorical field, see the totals, expand to inspect detail rows. The pivot model is the right tool only when the column set itself needs to be dynamic.
Related reading
- Building a Project / Task Board with a Svelte Data Grid
- Aggregation Functions Explained (Sum, Avg, Min, Max, Count)
- Pivot Tables in Svelte - Summarize Data Without a Spreadsheet
- Bundle Size of Svelte Data Grids - How to Compare
- Saved Views - Persist Grid Layout and Filters
Tagged: Row grouping, Aggregation