Pivot tables - Enterprise
A built-in pivot model that turns a flat data set into a row-axis tree,
a nested column-axis header, and one aggregated cell per
(row-path × col-path × measure) triple. Ships in @svgrid/enterprise.
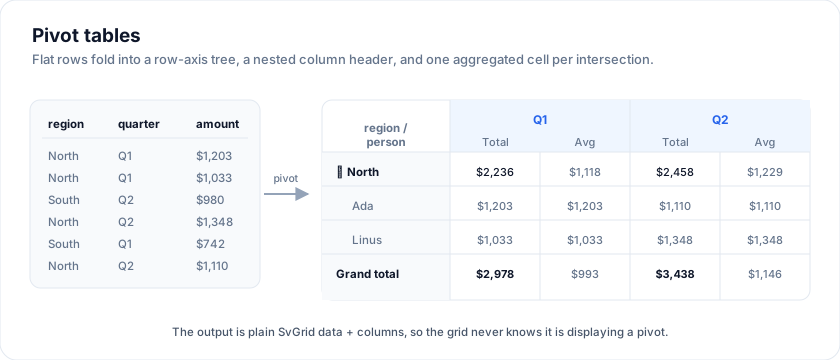
The output is plain SvGrid data + columns, so the rendering pipeline is the same one you already understand - the grid never knows it is displaying a pivot.
Open the live example: Pivot - Table + Designer (Pivot Grid)
Minimal example
import { createPivotModel } from '@svgrid/enterprise'
import {
  SvGrid, tableFeatures, rowSortingFeature, rowExpandingFeature,
} from '@svgrid/grid'

const features = tableFeatures({ rowSortingFeature, rowExpandingFeature })

const pivot = createPivotModel(orders, {
  rows:   ['region', 'salesPerson'],
  cols:   ['quarter'],
  values: [
    { field: 'amount', agg: 'sum', label: 'Total', format: { type: 'currency', currency: 'USD' } },
    { field: 'amount', agg: 'avg', label: 'Avg' },
  ],
})
<SvGrid
  data={pivot.rows}
  columns={pivot.columns}
  features={features}
  rowHeight={32}
/>
The result:
| region / salesPerson | 2024 Q1 Total | 2024 Q1 Avg | 2024 Q2 Total | ... | Grand total |
|---|---|---|---|---|---|
| (group) North | $48,210 | $1,203 | ... | ... | $211,090 |
| Ada | $12,400 | $1,033 | ... | ... | $58,200 |
| Linus | $35,810 | $1,348 | ... | ... | $152,890 |
| (group) South | ... | ... | ... | ... | ... |
| Grand total | $182,300 | $1,287 | ... | ... | $812,440 |
Via the imperative API
When you've called installEnterprise(api), the same builder hangs off the
api object so the designer UI can rebuild on every config change
without re-importing:
import { installEnterprise } from '@svgrid/enterprise'

const pro = installEnterprise(api)

function applyPivot(config: PivotConfig<Order>) {
  const result = pro.pivot.build(config)
  pivotRows    = result.rows
  pivotColumns = result.columns
}
pro.pivot.buildFrom(data, config) accepts an arbitrary array - useful
for previewing a designer's config against a small sample before
committing.
The PivotConfig shape
type PivotConfig<TData> = {
  /** Outer-most first. Each entry becomes one level of row grouping. */
  rows: ReadonlyArray<keyof TData & string>
  /** Outer-most first. Each entry becomes one level of column grouping. */
  cols: ReadonlyArray<keyof TData & string>
  /** One or more measures aggregated under each column-axis leaf. */
  values: ReadonlyArray<PivotValueConfig<TData>>
  /** Grand-total row at the bottom. Default `true`. */
  grandTotalRow?: boolean
  /** Grand-total column on the right. Default `true`. */
  grandTotalCol?: boolean
  /** Subtotal rows between row groups. Default `true`. */
  rowSubtotals?: boolean
  /** Sort axis values per dim level. Defaults to numeric/alpha. */
  colSort?: (a: unknown, b: unknown, level: number) => number
  rowSort?: (a: unknown, b: unknown, level: number) => number
}

type PivotValueConfig<TData> = {
  field: keyof TData & string
  agg: PivotAggregatorId | PivotAggregator
  label?: string
  format?: CellFormatConfig
}

type PivotAggregatorId =
  | 'sum' | 'avg' | 'min' | 'max'
  | 'count' | 'countDistinct'
  | 'first' | 'last'
For anything beyond the built-ins, pass a function: agg: (values) => weightedAvg(values, weights).
The PivotRow shape
Every entry in result.rows is a plain object:
type PivotRow = {
  __pivotId: string
  __pivotKind: 'group' | 'subtotal' | 'leaf' | 'grandTotal'
  __pivotDepth: number          // 0 for top-level groups / grand total
  __pivotLabel: string           // first-column label
  __pivotParentId: string | null // for filterCollapsedPivotRows; null = always visible
  __pivotExpandable: boolean     // true for group rows with descendants
  [columnId: string]: unknown    // value cells, keyed by leaf column id
}
Expandable rows
Each group row carries __pivotExpandable: true and each descendant
carries __pivotParentId pointing at its containing group. To make the
pivot collapsible: track an "expanded" Set<string> of group ids and
run the rows through filterCollapsedPivotRows:
<script lang="ts">
  import { createPivotModel, filterCollapsedPivotRows } from '@svgrid/enterprise'

  const pivot = createPivotModel(orders, config)
  let expanded = $state<Set<string>>(new Set())   // empty = all collapsed
  const visible = $derived(filterCollapsedPivotRows(pivot.rows, expanded))

  function toggle(id: string) {
    const next = new Set(expanded)
    if (next.has(id)) next.delete(id); else next.add(id)
    expanded = next
  }
</script>

<SvGrid
  data={visible}
  columns={pivot.columns}
  features={features}
/>
The first column's cell renderer is the natural place to draw the
expand/collapse chevron - check __pivotExpandable and __pivotKind
on the row:
{#snippet labelCell(ctx)}
  {@const row = ctx.row.original}
  <span style="padding-left: {row.__pivotDepth * 16}px">
    {#if row.__pivotExpandable}
      <button onclick={() => toggle(row.__pivotId)}>
        {expanded.has(row.__pivotId) ? '▾' : '▸'}
      </button>
    {/if}
    {row.__pivotLabel}
  </span>
{/snippet}
Pass true to filterCollapsedPivotRows to bypass filtering (all rows
visible); pass an empty Set to collapse everything to subtotals only.
Use __pivotKind to style subtotal / grand-total rows differently:
<SvGrid
  data={pivot.rows}
  columns={pivot.columns}
  features={features}
  rowClass={(row) => ({
    'pv-group':    row.__pivotKind === 'group',
    'pv-subtotal': row.__pivotKind === 'subtotal',
    'pv-grand':    row.__pivotKind === 'grandTotal',
  })}
/>
(The rowClass callback itself is on the
Missing features list; until it ships, target
rows via data-pivot-kind on a custom row snippet.)
Pivot designer UI
The pivot model is pure - drop a new config in, get a new
{ rows, columns } back. Wrapping this in a drag-and-drop designer is
the demo's job, not the engine's:
- Four drop zones: Filters / Rows / Columns / Values.
- Each zone is a plain
ondragover/ondroptarget. - When the user drops a measure into Values, prompt for the aggregator
or default to
sum. - Persist the
PivotConfigtolocalStoragefor cheap "saved views".
See demo 52 - Pivot table + Designer for a full ~400-line example.
Performance notes
The engine is a single pass over the input rows: it builds a row-axis tree and a column-axis tree, then for each (row-path × col-path) combination runs each measure aggregator over the matched source rows.
For an N-row dataset with R row-axis combos and C col-axis combos, the
cost is roughly O(N + R * C * V) where V is the number of measure
configs. In practice that means a 100k-row source pivots in under
~100 ms when the row+col cardinality is under a few hundred. For
million-row sources, run the pivot on the server and pass the result
straight into data / columns.
Frequently asked questions
Does SvGrid support pivot tables?
Yes, in the paid @svgrid/enterprise add-on. createPivotModel turns a flat data set
into a row-axis tree with a nested column-axis header and one aggregated cell
per (row-path × col-path × measure). The Community package does not include
pivoting.
How is pivot different from grouping?
Grouping (in Community) rolls rows up along the row axis only. Pivot also spreads a field across the column axis with nested headers and computes a measure for each row/column intersection.
Can I export a pivot table?
Yes. A pivot view exports to Excel/PDF/CSV like any other grid view through the
same @svgrid/enterprise export helpers.
More examples
Pivot mode grid
Built on
Open the live example: Pivot mode grid (Pivot Grid)
Pivot - Drill-through
Click any pivot value cell - leaf, subtotal, or grand total - and the right rail opens with the source facts behind the aggregate. Total + count + average always match the cell.
Open the live example: Pivot - Drill-through (Pivot Grid)
Pivot - Totals + Subtotals
Live toggles for grandTotalRow / grandTotalCol / rowSubtotals on createPivotModel. Subtotals get a Σ badge, the grand-total row is tinted accent, the grand-total column is an amber stripe.
Open the live example: Pivot - Totals + Subtotals (Pivot Grid)
Pivot - OLAP cube
Full BI dashboard around an OLAP cube: page header, 5 KPI tiles with QoQ sparklines, left slicer rail (region multi-select, year picker, country search, view-mode, density, heatmap toggle), cube in Tabular form (one column per row dim), right insights rail (top YoY movers, top contributors).
Open the live example: Pivot - OLAP cube (Pivot Grid)
Pivot - Linked charts
Pivot cube wired to a horizontal bar chart + multi-year line chart. Click any cube row to drill the charts one level deeper (region → country → product); scope KPI strip tracks selection; charts are zero-dep inline SVG.
Open the live example: Pivot - Linked charts (Pivot Grid)
Pivot - Analysis workspace
Excel-style pivot analysis: left-rail field picker (search + checkboxes) feeding four wells (Rows / Columns / Data / Filters), live re-pivot on every layout change, click-to-cycle aggregator chips, data-bar Total Spend cells + amber Avg Rating strips, subtotal + grand-total row tints.
Open the live example: Pivot - Analysis workspace (Pivot Grid)
Pivot - Designer component
SvPivotDesigner: self-contained, enterprise-ready pivot authoring with a left-rail field picker (search + grouped), four drop wells (Filters / Columns / Rows / Values), drag-and-drop between wells, per-chip aggregator + filter menus, presets toolbar, and an inline pivot grid driven by createPivotModel. Single bindable layout prop so the page can persist or restore it.
Open the live example: Pivot - Designer component (Pivot Grid)
Pivot chart
One drag-drop pivot layout, two synced views:
Open the live example: Pivot chart (Pivot Grid)
See also
- Column groups - multi-level column headers; pivot uses these for the column-axis tree.
- Demo 52 - Pivot table + Designer
- Data export and printing - Enterprise - the result of
createPivotModelexports like any other grid view.
Live examples
- Pivot - Table + Designer - Drag-and-drop Pivot Designer with Filters / Rows / Columns / Values zones, multi-level column headers, subtotal + grand-total rows, row-header sort menu.
- Pivot mode grid - Built on <SvPivotDesigner panelPosition="right">: a docked tool panel with a PIVOT MODE toggle, field checklist, and Columns / Rows / Values wells (drag-and-drop). OFF renders the flat participant grid (column groups, flags, ratings, inline filter row); ON pivots Language -> Country x Game with heat-mapped avg measures.
- Pivot - Drill-through - Click any pivot value cell - leaf, subtotal, or grand total - and the right rail opens with the source facts behind the aggregate. Total + count + average always match the cell.
- Pivot - Totals + Subtotals - Live toggles for grandTotalRow / grandTotalCol / rowSubtotals on createPivotModel. Subtotals get a Σ badge, the grand-total row is tinted accent, the grand-total column is an amber stripe.
- Pivot - OLAP cube - Full BI dashboard around an OLAP cube: page header, 5 KPI tiles with QoQ sparklines, left slicer rail (region multi-select, year picker, country search, view-mode, density, heatmap toggle), cube in Tabular form (one column per row dim), right insights rail (top YoY movers, top contributors).
- Pivot - Linked charts - Pivot cube wired to a horizontal bar chart + multi-year line chart. Click any cube row to drill the charts one level deeper (region → country → product); scope KPI strip tracks selection; charts are zero-dep inline SVG.
- Pivot - Analysis workspace - Excel-style pivot analysis: left-rail field picker (search + checkboxes) feeding four wells (Rows / Columns / Data / Filters), live re-pivot on every layout change, click-to-cycle aggregator chips, data-bar Total Spend cells + amber Avg Rating strips, subtotal + grand-total row tints.
- Pivot - Designer component - SvPivotDesigner: self-contained, enterprise-ready pivot authoring with a left-rail field picker (search + grouped), four drop wells (Filters / Columns / Rows / Values), drag-and-drop between wells, per-chip aggregator + filter menus, presets toolbar, and an inline pivot grid driven by createPivotModel. Single bindable `layout` prop so the page can persist or restore it.
- Pivot chart - One drag-drop pivot layout, two synced views: <SvPivotDesigner chartable> renders the SAME Rows / Columns / Values as either an expandable pivot grid or a chart (Columns -> series, Values -> measure). Powered by the enterprise pivot engine.
Related articles
- SvGrid Tips and Tricks: Get More from Your Svelte Data Grid - Practical SvGrid tips - fitColumns, cellFlash, Kanban board mode, server-side data, theming tokens and headless rendering - each with a code snippet and docs link.