Data export and printing
CSV / TSV / JSON export and copy-to-clipboard are free in the community @svgrid/grid - the commodity "data out" every grid needs. The richer formats - Excel (xlsx), legacy Excel (xls), PDF, styled HTML, XML, Markdown, multi-sheet workbooks, password protection, conditional-format export, and the drop-in export menu - ship in the paid @svgrid/enterprise add-on, which reuses the exact same serializers so the two tiers feel like one product.
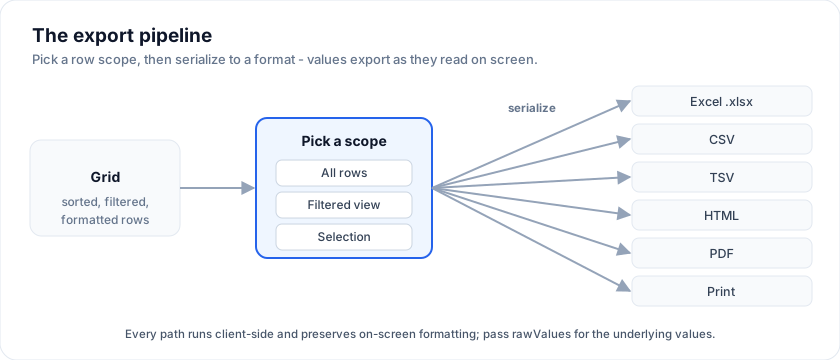
| Capability | Package |
|---|---|
| CSV / TSV / JSON export, copy-to-clipboard (TSV / CSV / Markdown) | Free (@svgrid/grid) |
Excel .xlsx (typed cells, styles, conditional formatting, tables, multi-sheet) |
Enterprise |
PDF, styled HTML, XML, legacy .xls, password-protected export |
Enterprise |
exportValue hook, conditional-format export, SvExportMenu, print() |
Enterprise |
Free: CSV / TSV / JSON + clipboard
The community grid's SvGridApi carries four zero-dependency methods - no
license, no peer deps:
The examples on this page run against these rows:
<script lang="ts">
  import { SvGrid, type GridColumns, tableFeatures, rowSortingFeature, columnFilteringFeature } from '@svgrid/grid'

  type Person = {
    id: number
    name: string
    email: string
    department: string
    age: number
    salary: number
    city: string
    startDate: string
    active: boolean
  }

  type Order = {
    id: string
    customer: string
    product: string
    quantity: number
    total: number
    status: 'pending' | 'shipped' | 'delivered'
    orderedAt: string
  }

  type Row = Person

  const features = tableFeatures({ rowSortingFeature, columnFilteringFeature })

  const people: Person[] = [
    { id: 1, name: 'Ada Lovelace',   email: '[email protected]',   department: 'Engineering', age: 36, salary: 142000, city: 'London',   startDate: '2021-03-01', active: true },
    { id: 2, name: 'Grace Hopper',   email: '[email protected]', department: 'Engineering', age: 45, salary: 168000, city: 'New York', startDate: '2019-07-15', active: true },
    { id: 3, name: 'Linus Torvalds', email: '[email protected]', department: 'Platform',    age: 54, salary: 155000, city: 'Portland', startDate: '2020-01-20', active: false },
    { id: 4, name: 'Radia Perlman',  email: '[email protected]', department: 'Networking',  age: 49, salary: 161000, city: 'Seattle',  startDate: '2022-09-05', active: true },
    { id: 5, name: 'Barbara Liskov', email: '[email protected]', department: 'Platform',  age: 52, salary: 172000, city: 'Boston',   startDate: '2018-11-11', active: true },
  ]

  let rows = $state<Person[]>(people)

  const columns: GridColumns<Person> = [
    { field: 'name',       header: 'Name',       width: 200 },
    { field: 'department', header: 'Department', width: 150 },
    { field: 'city',       header: 'City',       width: 140 },
    { field: 'age',        header: 'Age',        width: 90 },
    { field: 'salary',     header: 'Salary',     width: 130, format: { type: 'currency', currency: 'USD' } },
  ]
</script>
await api.exportCsv({ filename: 'orders' })   // orders.csv (BOM + Excel-friendly)
await api.exportTsv()                         // grid.tsv
await api.exportJson({ rows: 'selected' })    // grid.json, checked rows only
await api.copyToClipboard({ format: 'tsv' })  // paste straight into Excel / Sheets
Every method:
- defaults to the current view (
rows: 'selected' | 'all'to change), - formats values as shown on screen (currency, dates) - pass
rawValues: truefor the underlying values, - accepts a
columns: string[]field subset (in that order), - runs on a chunked, cancelable loop (
signal,onProgress) so a 100k-row export never freezes the tab, - returns the serialized text; pass
download: falseto skip the download and just get the string.
<script lang="ts">
  import { SvGrid, tableFeatures, type SvGridApi } from '@svgrid/grid'
  let api = $state<SvGridApi<any, Row> | null>(null)
</script>

<button onclick={() => api?.exportCsv({ filename: 'orders' })}>Export CSV</button>
<button onclick={() => api?.copyToClipboard()}>Copy for Excel</button>
<SvGrid data={rows} columns={columns} features={features} onApiReady={(a) => (api = a)} />
The rest of this page covers the Enterprise formats.
Try the export bar below - downloads run in your browser; the bundled license key removes the unlicensed watermark:
Open the live example: Export + Print (Data Export & Import)
What it is
@svgrid/enterprise augments the SvGridApi you already get from
<SvGrid onApiReady> with two methods:
api.exportData({ format, filename?, columns?, rows?, pageOrientation? })api.print({ title?, columns?, rows?, orientation? })
Both methods default to the currently displayed rows - sort, filter, or paginate the grid, and the export reflects that view automatically.
When to use it
- Reporting flows where users want to take the grid offline (spreadsheets, emailed PDFs).
- Compliance / audit trails that require a printable artifact.
- Quick CSV/TSV pulls for downstream pipelines.
If you only need machine-readable data, prefer CSV / TSV - they have no peer dependencies and produce the smallest files. Use xlsx / PDF only when the recipient expects formatted documents.
Minimal example
<script lang="ts">
  import { SvGrid, tableFeatures, rowSortingFeature, type SvGridApi, type ColumnDef } from '@svgrid/grid'
  import { installEnterprise, setLicenseKey, type EnterpriseGridApi } from '@svgrid/enterprise'

  // Set the license key once at startup. Without a key, the feature still
  // works but the grid shows an "unlicensed" watermark and the console
  // emits a one-time nudge directing users to the pricing page.
  setLicenseKey('SVENTERPRISE-XXXX-XXXX-XXXX')

  const features = tableFeatures({ rowSortingFeature })

  type Order = { company: string; product: string; price: number }
  const rows: Order[] = [
    { company: 'ACME',  product: 'Widget',  price: 19.95 },
    { company: 'Globex', product: 'Gadget', price: 49.00 },
  ]
  const columns: ColumnDef<typeof features, Order>[] = [
    { field: 'company', header: 'Company' },
    { field: 'product', header: 'Product' },
    { field: 'price',   header: 'Price', format: { type: 'currency', currency: 'USD' } },
  ]

  let api = $state<EnterpriseGridApi<typeof features, Order> | null>(null)

  function onReady(next: SvGridApi<typeof features, Order>) {
    api = installEnterprise(next)
  }
</script>

<button onclick={() => api?.exportData({ format: 'xlsx', filename: 'orders' })}>
  Export Excel
</button>
<button onclick={() => api?.exportData({ format: 'pdf', filename: 'orders', pageOrientation: 'landscape' })}>
  Export PDF
</button>
<button onclick={() => api?.print({ title: 'Orders' })}>
  Print
</button>

<SvGrid data={rows} columns={columns} features={features} onApiReady={onReady} />
Install
pnpm add @svgrid/enterprise
# Optional - install only the peers you actually use:
pnpm add jszip     # required for xlsx
pnpm add pdfmake   # required for pdf
CSV, TSV, HTML, and Print have no extra dependencies. The peer dependencies are lazy-loaded only when you call the format that needs them.
Licensing
@svgrid/enterprise has a tiered license gate:
| Key state | Behavior |
|---|---|
No key set (setLicenseKey() not called) |
Feature works. Grid shows an unlicensed watermark linking to jqwidgets.com; console.log emits a one-time nudge. |
Key doesn't start with SVENTERPRISE- |
Throws - programmer error. |
| Key is in the revoked list | Throws - contact support for a replacement. |
SVENTERPRISE-DEV-... or SVENTERPRISE-EVAL-... |
Works. One-time console.info notice. No watermark. |
Any other SVENTERPRISE-... |
Works silently. |
Buy a production key at https://svgrid.com/pricing/ ($599 / developer /
year). SVENTERPRISE-DEV-... and SVENTERPRISE-EVAL-... keys cover local development
and 30-day trials respectively.
Reference
setLicenseKey(key: string): void
Stores the key in module state. Call once at app startup (e.g. in
main.ts). Subsequent calls overwrite.
clearLicenseKey(): void · hasValidLicense(): boolean · dismissUnlicensedNudge(): void
Programmatic helpers. hasValidLicense() is useful when you want UI to
branch on license status. dismissUnlicensedNudge() removes the
watermark and stops the MutationObserver - call it after setting a
valid key if you toggled the soft-gate during testing.
installEnterprise(api): EnterpriseGridApi
Mutates the given SvGridApi to add exportData and print. Returns
the same object with the augmented type, so existing references keep
working.
api.exportData(opts) - Promise<void>
| Option | Type | Default | Notes |
|---|---|---|---|
format |
'xlsx' | 'xls' | 'pdf' | 'csv' | 'tsv' | 'html' | 'json' | 'xml' | 'md' |
required | xlsx needs jszip, pdf needs pdfmake. xls / CSV / TSV / HTML / JSON / XML / Markdown are dependency-free. |
pdf |
PdfExportOptions |
- | PDF layout: page size, margins, title / subtitle / logo, theme colors, column widths, repeated header, page numbers. See "PDF options". |
conditionalFormats |
ConditionalFormat[] |
- | Same array as <SvGrid conditionalFormats>; carried into pdf / xlsx / html. See "Conditional formatting in exports". |
freezeHeader |
boolean |
true |
Freeze the header row (xlsx / xls). |
freezeColumns |
number |
pinned cols | Freeze this many leading columns (xlsx / xls). Defaults to the grid's left-pinned columns. |
autoFitColumns |
boolean |
true |
Size columns to content (xlsx / xls); a column's explicit width wins. |
precisionSafe |
boolean |
false |
Export long integer IDs (> 15 digits) as text so Excel's float precision doesn't round them (xlsx / xls). |
excelTable |
boolean | { totalsRow?; style? } |
- | Wrap single-sheet xlsx in a native Excel Table (filter dropdowns, banded rows; { totalsRow: true } adds SUM formulas). |
download |
boolean |
true |
When false, return the {@link ExportResult} without downloading. |
filename |
string |
"grid" |
Extension is appended if missing. |
columns |
{ field; header?; format?; align?; exportValue? }[] |
grid's own columns | Drives column selection + header labels. Auto-derived from the grid (with each column's format) when omitted. See exportValue below. |
rows |
ReadonlyArray<TData> | 'displayed' | 'selected' | 'all' |
'displayed' |
'displayed' = current filtered/sorted/paged view, 'selected' = checked rows, 'all' = full dataset, or pass an explicit array. |
rawValues |
boolean |
false |
By default the exporter writes the formatted display value (what you see). Set true to write raw underlying values (numbers stay numeric in xlsx). |
autoGroup |
boolean |
true |
Carry the grid's active row grouping into xlsx outline rows. Pass your own groupBy to override, or false to ignore. |
csv |
{ delimiter?; eol?; bom? } |
{ ',', '\r\n', BOM } |
CSV / TSV tuning. UTF-8 BOM is on by default so Excel opens it without mojibake. |
onProgress |
(p) => void |
- | Progress for large exports: { phase, ratio, row?, total? }, phase = 'project' | 'serialize' | 'write'. |
signal |
AbortSignal |
- | Cancel an in-flight export (checked between chunks). Rejects with AbortError. |
pageOrientation |
'portrait' | 'landscape' |
"portrait" |
PDF only. |
merges |
{ row; col; rowSpan?; colSpan? }[] |
[] |
Merged cells (xlsx / pdf). Zero-based body row/col (header excluded). Single-sheet only; mutually exclusive with groupBy / hierarchical. |
Faithful values (what you see is what you export)
By default the export renders each cell the way the grid does on screen: a
column with format: { type: 'currency', currency: 'USD' } exports $19.95,
a date column exports its formatted date, a percent column exports 42%. This
holds for every format (csv / tsv / html / pdf / xlsx). Pass
rawValues: true to write the underlying values instead (e.g. feeding a data
pipeline that wants the numeric 19.95).
For columns whose on-screen value comes from a custom cell renderer, a
fieldFn, or a lookup, give the column an exportValue hook - it takes
precedence over format and the raw field:
await api.exportData({
  format: 'xlsx',
  columns: [
    { field: 'company', header: 'Company' },
    // a column rendered with a custom snippet on screen:
    { field: 'status', header: 'Status', exportValue: (row) => STATUS_LABELS[row.status] },
  ],
})
Export only what's selected
// current view (default)
await api.exportData({ format: 'xlsx' })
// only the checked rows
await api.exportData({ format: 'xlsx', rows: 'selected' })
// the entire underlying dataset, ignoring filters/paging
await api.exportData({ format: 'csv', rows: 'all' })
Large exports: progress + cancel
CSV / TSV / HTML are serialized natively (no peer dependency) and stream in chunks, yielding to the event loop so a big export doesn't freeze the tab:
const controller = new AbortController()
await api.exportData({
  format: 'csv',
  rows: 'all',
  signal: controller.signal,
  onProgress: ({ ratio }) => updateProgressBar(ratio),
})
// controller.abort() rejects the export with an AbortError
Excel-native numbers (xlsx)
A single-sheet xlsx export writes numeric, currency, percent, and date
columns as real typed cells with an Excel number format - so Excel can sum
and sort them, and they still display formatted (currency symbol, thousands,
%, date pattern) - via SvGrid's own OOXML writer. Set rawValues: true for
unformatted raw values. The grouped-outline, multi-sheet, image, and merged-cell
paths use the bundled writer (formatted-string cells). The legacy xls format
is always typed.
Excel fidelity: freeze, auto-fit, hyperlinks
xlsx and xls exports polish the spreadsheet automatically:
- Freeze header - the header row stays visible when scrolling. On by
default;
freezeHeader: falseto disable,freezeColumns: nto also freeze leading columns. - Auto-fit column widths - columns are sized to their content. On by
default (
autoFitColumns: falseto disable); a column's explicitwidth(pixels) always wins. - Hyperlinks - give a column a
link(row)hook to render clickable links. Works inxlsx,xls,html,pdf, andprint.
Single-sheet xlsx is written by SvGrid's own OOXML writer, so numbers/dates
stay typed with number formats, conditional-format colors are real per-cell
fills, and freeze/widths/hyperlinks all apply. (Grouped/outline, multi-sheet,
embedded-image, and merged-cell exports use the bundled writer.)
await api.exportData({
  format: 'xlsx',
  freezeHeader: true,        // default
  columns: [
    { field: 'name', header: 'Company', width: 220,
      link: (row) => `https://crm.example.com/accounts/${row.id}` },
    { field: 'revenue', header: 'Revenue', format: { type: 'currency', currency: 'USD' } },
  ],
})
Conditional-format colors (data bars / color scales) already render as real
cell fills in xlsx, which is higher fidelity than the writer's built-in
rule-only conditional formatting - so we keep the per-cell approach.
Get the file instead of downloading (download: false)
exportData returns an ExportResult for the dependency-free paths
(csv/tsv/html/json/xml/md, xls, pdf, single-sheet xlsx) so you can preview,
upload, email, or attach the file. With download: false it builds and returns
the file without triggering a browser download:
const res = await api.exportData({ format: 'xlsx', download: false })
// res: { blob, filename, mime, rowCount, byteSize }
await uploadToStorage(res.blob, res.filename)
The grouped / multi-sheet / image / blanket-styled xlsx paths use the vendored
writer, which downloads directly and returns undefined (and throws on
download: false).
Excel Table (filter dropdowns + totals row)
Wrap a single-sheet xlsx in a native Excel Table - the user gets column
filter dropdowns, banded rows, structured references, and (optionally) a totals
row with live SUM() formulas:
await api.exportData({ format: 'xlsx', excelTable: { totalsRow: true } })
// or just `excelTable: true` for the table without a totals row
Column widths auto-fit and leading pinned columns are frozen automatically
(override with freezeColumns). For long IDs, precisionSafe: true writes them
as text so Excel's 15-digit float limit doesn't silently round 1002000300040005.
JSON / XML / Markdown
await api.exportData({ format: 'json' })  // array of { field: value } - defaults to raw values
await api.exportData({ format: 'xml' })   // <rows><row><field>value</field>…
await api.exportData({ format: 'md' })    // GitHub-flavored Markdown table (great for docs / LLMs)
JSON defaults to raw values (real numbers/dates) since it's a data format;
pass rawValues: false for formatted strings. XML and Markdown use the
formatted display values.
Copy to clipboard
api.copyExport(opts) serializes to the clipboard instead of downloading a
file - handy for "copy these rows into a spreadsheet or an email":
await api.copyExport({ format: 'tsv' })          // pastes into Excel / Sheets as columns (default)
await api.copyExport({ format: 'md', rows: 'selected' })  // Markdown table of the checked rows
await api.copyExport({ format: 'html' })         // rich text/html - keeps the table when pasted
Supported formats: csv, tsv, html, json, xml, md. html writes
both text/html (rich paste) and a text/plain fallback. Needs a secure
context and a user gesture (call it from a click).
Conditional formatting in exports
Pass the same conditionalFormats array you give <SvGrid> to carry the grid's
color scales, data bars, icon sets, and predicate rules into the styled
formats - PDF, xlsx, and HTML (and print()):
const conditionalFormats = [
  { type: 'colorScale', columns: ['score'], min: '#dcfce7', max: '#fee2e2' },
  { type: 'rule', columns: ['status'], when: ({ value }) => value === 'Overdue', background: '#fecaca' },
]

await api.exportData({ format: 'pdf', conditionalFormats })
await api.exportData({ format: 'xlsx', conditionalFormats }) // real cell fills in Excel
await api.print({ conditionalFormats })
Cell background, text color, and bold carry through as real cell fills in
xlsx (single-sheet), xls, html, and pdf; icon sets prepend their glyph
to the cell text.
In xlsx, data bars and color scales become native Excel
conditional formatting (<conditionalFormatting> rules) - Excel draws and
recomputes them itself, so they're interactive, not a static snapshot.
Predicate rule formats stay as computed per-cell fills. In the other styled
formats (xls / html / pdf) a data bar degrades to a light fill of the bar
color (cells can't hold a partial-width bar). The data formats (csv / tsv /
json / xml / md) are unstyled, so conditional formatting is ignored there.
Grouped PDF exports skip conditional formatting (the group/subtotal rows own the
layout).
PDF options
The PDF is built from a full pdfmake document you control via pdf:
await api.exportData({
  format: 'pdf',
  filename: 'orders',
  pdf: {
    pageSize: 'A4',            // 'A4' | 'A3' | 'A5' | 'LETTER' | 'LEGAL'
    pageOrientation: 'landscape',
    title: 'Q3 Orders',
    subtitle: 'Generated by Ops',
    logo: logoDataUrl,        // top-left image (data URL)
    headerColor: '#334155',   // header row fill
    zebra: true,              // striped rows
    columnWidths: '*',        // '*' fill, 'auto', or a per-column pt array
    // repeatHeader (default true), showPageNumbers (default true) also available
  },
})
The header row repeats on every page, each page gets a Page X of Y +
date footer, per-column alignment is honored, and wide grids auto-switch to
landscape (override with pdf.pageOrientation).
When the grid is grouped, the PDF carries the grouping: a bold group header
per cluster (nested for multi-level grouping) and a subtotal row summing the
number / currency columns - matching the xlsx outline export. It's on by
default (autoGroup); pass groupBy to override or autoGroup: false to get a
flat table.
Merged cells
Pass merges to write real merged regions into the sheet. Row / column
indices are zero-based over the exported body (the header row is not
counted), and the shape lines up with the grid's own MergeSpec:
// Merge the first two data rows of column 0, and span a 3-column banner
await api.exportData({
  format: 'xlsx',
  merges: [
    { row: 0, col: 0, rowSpan: 2 },   // vertical merge (e.g. a repeated group key)
    { row: 5, col: 0, colSpan: 3 },   // horizontal merge (a section banner)
  ],
})
To export the merges you already show in the grid, take your MergeSpec[]
({ rowIndex, columnId, rowspan, colspan }) and map columnId to its column
index: { row: m.rowIndex, col: colIndex(m.columnId), rowSpan: m.rowspan, colSpan: m.colspan }.
Throws on missing peer (jszip / pdfmake), revoked / malformed
license, or empty result set. With no license set, it runs but the
grid is watermarked.
api.print(opts?) - Promise<void>
Opens a new window with a paginated, printable rendering of the grid and
triggers the browser print dialog. This is the zero-dependency "Save as PDF"
route: it uses the browser's own engine, so it has excellent font + CSS
fidelity (including CJK / RTL) and needs no pdfmake. The header row repeats on
every page, values print formatted (matching the grid), and columns keep
their alignment.
| Option | Type | Default |
|---|---|---|
title |
string |
"Grid" |
subtitle |
string |
- |
logo |
string (data URL) |
- |
columns |
{ field; header?; format?; align? }[] |
grid's own columns |
rows |
ReadonlyArray<TData> | 'displayed' | 'selected' | 'all' |
'displayed' |
rawValues |
boolean |
false |
orientation |
'portrait' | 'landscape' |
"portrait" |
pageSize |
string (e.g. 'A4', 'Letter') |
browser default |
margin |
string (e.g. '14mm') |
'14mm' |
zebra |
boolean |
true |
headerColor |
string |
'#f1f5f9' |
Browsers may block the popup unless print() is called from a user
gesture (a click handler is fine - automatic on-load print is not). Page
numbers come from the browser's own print header/footer.
exportData({ format: 'pdf' }) vs print() - use PDF export for a
programmatic, silent file download with full layout control (see "PDF
options"); use print() when you want best-fidelity output and the user to
pick print or "Save as PDF" from the dialog.
Drop-in Export menu (SvExportMenu)
Rather than wiring your own toolbar, drop in the bundled SvExportMenu
component. It renders an "Export" button with a format picker, a row-scope
toggle (current view / selected / all), and a built-in progress bar + Cancel
for large exports:
<script lang="ts">
  import { SvGrid, type SvGridApi } from '@svgrid/grid'
  import { installEnterprise, SvExportMenu, type EnterpriseGridApi } from '@svgrid/enterprise'

  let api = $state<EnterpriseGridApi<typeof features, Order> | null>(null)
</script>

<div class="toolbar">
  <SvExportMenu {api} filename="orders" />
</div>

<SvGrid data={rows} columns={columns} features={features}
  onApiReady={(a) => (api = installEnterprise(a))} />
| Prop | Type | Default | Notes |
|---|---|---|---|
api |
EnterpriseGridApi | null |
required | Button is disabled until the api is ready. |
filename |
string |
'grid' |
Base name, no extension. |
formats |
ExportFormat[] |
xlsx/xls/pdf/csv/tsv/html | Which formats to offer, in order. |
allowScope |
boolean |
true |
Show the current-view / selected / all toggle. |
allowColumns |
boolean |
true |
Show per-column include checkboxes (choose which columns to export). |
allowCopy |
boolean |
true |
Show "Copy for Excel" (tsv) + "Copy Markdown" clipboard actions. |
allowPrint |
boolean |
false |
Show a "Print…" action (api.print). |
scope |
'displayed' | 'selected' | 'all' |
'displayed' |
Initial row scope. |
label |
string |
'Export' |
Button text. |
conditionalFormats |
ConditionalFormat[] |
- | Carried into pdf / xlsx / html exports. |
The menu is sectioned into Rows (scope), Columns (a picker), and
Download (each format shown with an icon + one-line description), plus
copy-to-clipboard and optional print actions. It's keyboard
accessible (arrow keys move between items, Tab is trapped inside, Esc closes
and returns focus to the button, with role="menu" / menuitem), handles
errors inline (missing peer dependency, empty grid), and wires onProgress +
an AbortController for you.
For large exports, the single-sheet xlsx writer builds in chunks that yield to
the event loop (and zips asynchronously), so the tab stays responsive and
onProgress ticks; pass a signal to cancel.
Gotchas
- Empty grids - both
exportDataandprintthrow if there are no displayed rows. Catch the error and show a notice in the UI. - Column ordering - if you don't pass
columns, the export usesObject.keys(rows[0])order. Passcolumnsexplicitly when the row shape doesn't match the column order you want. - Cell formatters - column-level format hints (date, number, currency,
percent) are applied to the exported value by default, so the file matches
the grid. Custom snippet renderers are not auto-serialized - give those
columns an
exportValuehook (see "Faithful values" above), or setrawValues: trueif you want the raw underlying values. - Print popup blocked -
print()resolves but the browser silently blocks the new window. Always trigger from a user click, and surface the thrown error. - Bundle size - the vendored exporter is ~50 KB minified. It is loaded lazily on first call so it does not bloat the initial bundle for users who never export.
Frequently asked questions
How do I export a Svelte data grid to Excel?
Install @svgrid/enterprise, call installEnterprise(api), then call the export helper with
format: 'xlsx'. The exporter writes a real OOXML workbook in the browser - no
server round-trip. CSV, TSV, PDF, and HTML use the same call with a different
format.
What's the difference between xls and xlsx?
xlsx is the modern OOXML workbook (Excel 2007+); it needs the jszip peer
dependency and supports the richest output (styles, images, multi-sheet,
formulas). xls is the legacy Excel 2003 XML Spreadsheet format: pick it
for maximum compatibility with old Excel installs or systems that only accept
.xls. It has no peer dependency, streams in the browser, and keeps
numbers and dates typed (so sums and sorting still work in Excel) with number
formats applied. It's single-sheet - use xlsx for multi-tab workbooks.
await api.exportData({ format: 'xls', filename: 'orders' })
Is export part of the free Community package?
No. Export and printing ship in the paid @svgrid/enterprise add-on. The free
@svgrid/grid package covers the full grid (sorting, filtering, grouping,
editing, virtualization) but not export/print/pivot/import.
Does exporting bloat my bundle?
No. The ~50 KB exporter is lazy-loaded on the first export call, so users who never export never download it.
More examples
Password-protected export
PBKDF2 (100k iters) + AES-GCM 256 client-side. Strength meter, encrypt + download, in-page decrypt tool to verify the round-trip. Enterprise pack maps to ECMA-376 Agile encryption.
Open the live example: Password-protected export (Data Export & Import)
Formulas preserved in xlsx
Builds a real OOXML workbook in the browser via JSZip; computed columns export as
Open the live example: Formulas preserved in xlsx (Data Export & Import)
Export grouped grid to Excel
A flat sales grid (Region → Country) exported via api.exportData({ format: "xlsx", groupBy }) which uses Smart's NATIVE Excel row outline grouping. Opens in Excel with +/- buttons in the row header gutter for every group level.
Open the live example: Export grouped grid to Excel (Data Export & Import)
Export pivot grid to Excel
createPivotModel leaves projected into an xlsx via api.exportData with groupBy: ["region"] - each region becomes an Excel outline group. Engine column ids ("pv__Q1__m0") translate to readable headers ("Q1 · Revenue").
Open the live example: Export pivot grid to Excel (Data Export & Import)
Export - Formatting, scope + XLS
Faithful export: currency / date / percent render as shown (toggle raw values), pick a row scope (view / selected / all), legacy .xls (Excel 2003 XML, no jszip), an exportValue hook, and the drop-in SvExportMenu.
Open the live example: Export - Formatting, scope + XLS (Data Export & Import)
Export - Grouped PDF + Print
Group the grid and export: the PDF + xlsx carry bold group headers and per-cluster subtotal rows (auto-carried from grouping state). Polished Print is the zero-dependency "Save as PDF" route with a repeated header and title.
Open the live example: Export - Grouped PDF + Print (Data Export & Import)
Try the export API
Every exporter is on the grid api and takes the same
GridExportOptions. rows: 'displayed' is the default and is almost always
what a user means by "export this" - it follows their filter and sort.
<script lang="ts">
  let api = $state<SvGridApi<{}, Person> | null>(null)
</script>

<div>
  <button type="button" onclick={() => api?.exportCsv({ filename: 'people' })}>CSV</button>
  <button type="button" onclick={() => api?.exportTsv({ filename: 'people' })}>TSV</button>
  <button type="button" onclick={() => api?.exportJson({ filename: 'people' })}>JSON</button>
  <button type="button" onclick={() => api?.print()}>Print</button>
</div>

<SvGrid data={people} {columns} sortable filterable onApiReady={(next) => (api = next)} />
Sort or filter first, then export: the file follows the view.
Exporting a subset
columns restricts the fields and fixes their order, and rawValues decides
whether the file carries what the screen shows or what the row holds. The
salary column is the one to watch - formatted it is $142,000, raw it is
142000, and a spreadsheet can only do arithmetic on the second.
<script lang="ts">
  let api = $state<SvGridApi<{}, Person> | null>(null)
</script>

<div>
  <button type="button" onclick={() => api?.exportCsv({ filename: 'formatted', columns: ['name', 'salary'] })}>
    Name + salary, as displayed
  </button>
  <button type="button" onclick={() => api?.exportCsv({ filename: 'raw', columns: ['name', 'salary'], rawValues: true })}>
    Name + salary, raw values
  </button>
</div>

<SvGrid data={people} {columns} onApiReady={(next) => (api = next)} />
Live examples
- Export + Print - Enterprise feature pack: download to Excel, PDF, CSV, TSV, HTML, or open a printable view in a new window.
- Password-protected export - PBKDF2 (100k iters) + AES-GCM 256 client-side. Strength meter, encrypt + download, in-page decrypt tool to verify the round-trip. Enterprise pack maps to ECMA-376 Agile encryption.
- Formulas preserved in xlsx - Builds a real OOXML workbook in the browser via JSZip; computed columns export as <f>...</f> formula cells. Open in Excel and the math recomputes when you edit a number.
- Export grouped grid to Excel - A flat sales grid (Region → Country) exported via api.exportData({ format: "xlsx", groupBy }) which uses Smart's NATIVE Excel row outline grouping. Opens in Excel with +/- buttons in the row header gutter for every group level.
- Export pivot grid to Excel - createPivotModel leaves projected into an xlsx via api.exportData with groupBy: ["region"] - each region becomes an Excel outline group. Engine column ids ("pv__Q1__m0") translate to readable headers ("Q1 · Revenue").
- Export - Formatting, scope + XLS - Faithful export: currency / date / percent render as shown (toggle raw values), pick a row scope (view / selected / all), legacy .xls (Excel 2003 XML, no jszip), an exportValue hook, and the drop-in SvExportMenu.
- Export - Grouped PDF + Print - Group the grid and export: the PDF + xlsx carry bold group headers and per-cluster subtotal rows (auto-carried from grouping state). Polished Print is the zero-dependency "Save as PDF" route with a repeated header and title.
Related articles
- SvGrid Tips and Tricks: Get More from Your Svelte Data Grid - Practical SvGrid tips - fitColumns, cellFlash, Kanban board mode, server-side data, theming tokens and headless rendering - each with a code snippet and docs link.