Measuring Data Grid Performance in DevTools
A practical profiling workflow for SvGrid - how to read the Performance panel, catch virtualization failures, diagnose layout thrash, and make changes that measurably help.
"It feels slow" is not a bug report, it is a hypothesis. Before you touch a single line of grid code, you need a number - a frame time, a node count, a millisecond budget. Without that number, you cannot know whether your fix helped, hurt, or just reshuffled the problem somewhere less visible.
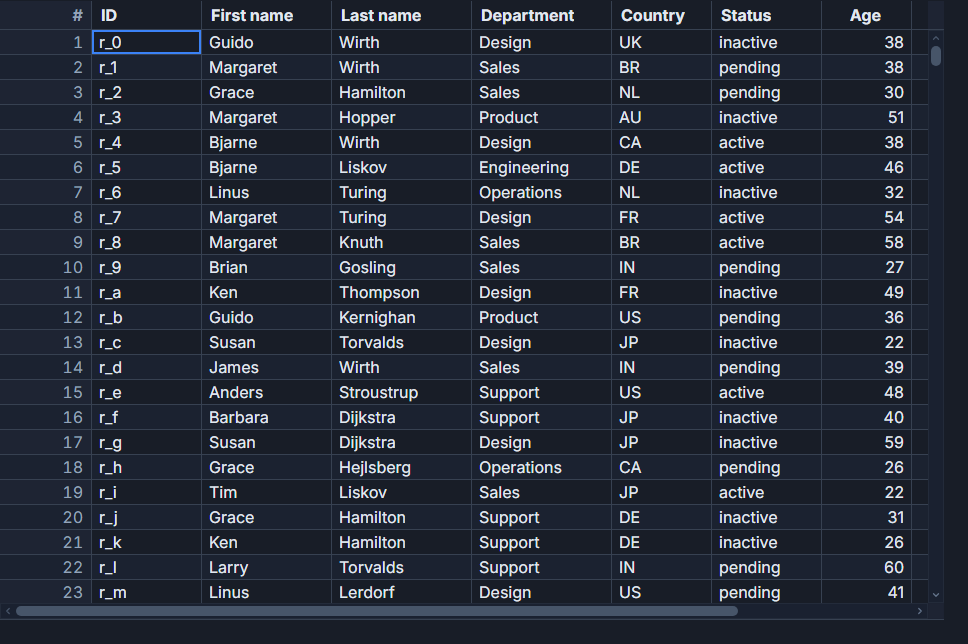
Here is the workflow I actually use when a grid starts misbehaving under load.
Capture a baseline before anything else
Open Chrome DevTools, switch to the Performance tab, and set CPU throttle to 4x (found in the gear icon). This simulates a mid-range laptop and surfaces problems your developer machine hides. Then hit Record, do the exact interaction that feels slow - scroll from top to bottom, sort a column with 50 000 rows, type in a filter box - and stop after 5-8 seconds.
You are looking for three things in the recording:
- Long tasks - any orange triangle on the main thread timeline marks a task over 50ms. These are the ones that block input response.
- Frame duration - hover over the green frame bars at the top. 60fps means 16.7ms per frame. If your scroll frames are hitting 80ms, you have dropped 4 out of 5.
- What fills the long frames - drill down into a bad frame. Yellow is scripting (JS), purple is rendering (style/layout), green is painting. The color that dominates tells you where to look first.
Save the trace file (Export profile button). You will re-import it later to compare against your fix.
DOM node count is the fastest virtualization check
With 50 000 rows, SvGrid should only render the ~30-50 rows visible in the viewport at any moment. Pop open the Console and run:
document.querySelectorAll('[data-row-index]').length
Note the number, scroll halfway down, run it again. If the count is stable (say, 38 to 42 rows), virtualization is working. If it grows linearly with scroll position, the virtual scroller is not engaging.
The almost-universal cause: the grid container has no explicit height. The virtualizer measures the container to decide how many rows to render, and if it reads 0 or auto, it falls back to rendering everything.
<!-- Wrong: the grid has no bounded height, so virtualization falls back -->
<div>
  <SvGrid {data} {columns} virtualization={true} />
</div>

<!-- Right: explicit height gives the virtualizer a real measurement -->
<div style="height: 600px; overflow: hidden;">
  <SvGrid {data} {columns} virtualization={true} />
</div>
You can also pass rowHeight explicitly. When SvGrid knows the row height upfront, it skips a measurement pass per row during initial render:
<SvGrid
  {data}
  {columns}
  rowHeight={34}
  virtualization={true}
  onApiReady={(api) => { gridApi = api }}
/>
Reading a scripting spike
When yellow (scripting) dominates your bad frames, expand the flame chart to find the hot function. Two patterns show up constantly:
Array allocation on every render. If you pass data={rows.map(transform)} as an inline expression, Svelte re-evaluates it every time any reactive state changes, creating a new array identity on every tick. Move the transform outside:
<script>
  import SvGrid from '@svgrid/grid'
  import { tableFeatures, rowSortingFeature } from '@svgrid/grid'

  let rawRows = $state(fetchedData)

  // Bad: new array reference every render
  // <SvGrid data={rawRows.map(enrichRow)} {columns} />

  // Good: derived updates only when rawRows changes
  const rows = $derived(rawRows.map(enrichRow))
</script>

<SvGrid data={rows} {columns} sortable />
Cell components re-mounting. If your custom cell creates a Svelte component per row and those components mount/unmount on every scroll, you will see a wall of component lifecycle calls in the flame chart. Snippets are lighter than components for simple cells:
<script>
  import SvGrid, { type ColumnDef } from '@svgrid/grid'
  import { tableFeatures, rowSortingFeature, columnFilteringFeature } from '@svgrid/grid'

  const features = tableFeatures({ rowSortingFeature, columnFilteringFeature })

  const columns: ColumnDef<typeof features, Product>[] = [
    { id: 'name', field: 'name', header: 'Name', width: 220 },
    { id: 'stock', field: 'stock', header: 'Stock', width: 100, cell: stockCell },
    { id: 'price', field: 'price', header: 'Price', width: 110, type: 'number' },
  ]
</script>

{#snippet stockCell({ value })}
  <span class:low={value < 10} class:out={value === 0}>{value}</span>
{/snippet}

<SvGrid data={products} {columns} {features} virtualization={true} rowHeight={34} />
A snippet is just a function call. A component is a full lifecycle - mount, update, destroy. For cells that render thousands of times per second during a scroll, that difference is not academic.
Forced reflow warnings
If you see red "Forced reflow" annotations in the timeline, you have layout thrash: something reads a layout property (like offsetHeight or getBoundingClientRect) and then writes to the DOM, forcing the browser to flush and recalculate layout synchronously.
In grid code, this usually happens in a custom cell that reads the row element's dimensions and then applies a class. The fix is to separate reads and writes, or use a ResizeObserver instead of reading layout imperatively.
Check whether the reflow is inside your code or inside SvGrid itself. Expand the stack trace in the reflow warning. If it traces into your cell snippet, that is yours to fix. If it traces into grid internals, file an issue with the trace.
Compare before and after
After making a change, re-record the same interaction - same scroll path, same duration, same throttle setting. Import the old trace in one DevTools window, open the new one alongside it, and compare:
- Average frame time during the scroll
- Max long task duration
- DOM node count stability
If your change shortened average frame time from 80ms to 22ms, that is a real improvement. If the numbers are the same, you changed the wrong thing. This sounds obvious but most performance work skips this step and ends up with "optimizations" that do nothing measurable.
A quick profiling checklist
Before filing a performance bug or spending a day optimizing:
- Confirmed CPU throttle was on during the profile (4x or 6x)
- Checked DOM node count during scroll - stable or climbing?
- Identified whether the bottleneck is yellow (scripting), purple (layout), or green (paint)
- Verified the grid container has an explicit pixel height
- Checked that
datais not being reallocated on every tick - Compared a before/after trace with the same interaction
Most grid performance problems fall into one of three buckets: missing container height breaking virtualization, rebuilding data arrays on every reactive update, or cell components that are heavier than they need to be. The flame chart tells you which bucket you are in, and then the fix is usually straightforward. Measurement is the part that takes discipline.
Related reading
- Stable Row Identity in SvGrid (and why it matters)
- Reducing Re-Renders in SvGrid with $derived
- Lazy-Loading Master-Detail Content in SvGrid
- Immutable Grid Updates Without Killing Performance
- Avoiding Layout Thrash in Custom Grid Cells
Tagged: Performance