Conditional Formatting - Color Cells by Their Value
Four rule types, one prop - add heatmaps, data bars, icon sets, and threshold highlights to any SvGrid column without custom cell renderers.
Most spreadsheet users reach for conditional formatting before they reach for pivot tables or charts. It is the fastest way to make a table scannable - and in SvGrid it takes one prop and a typed array of rules.
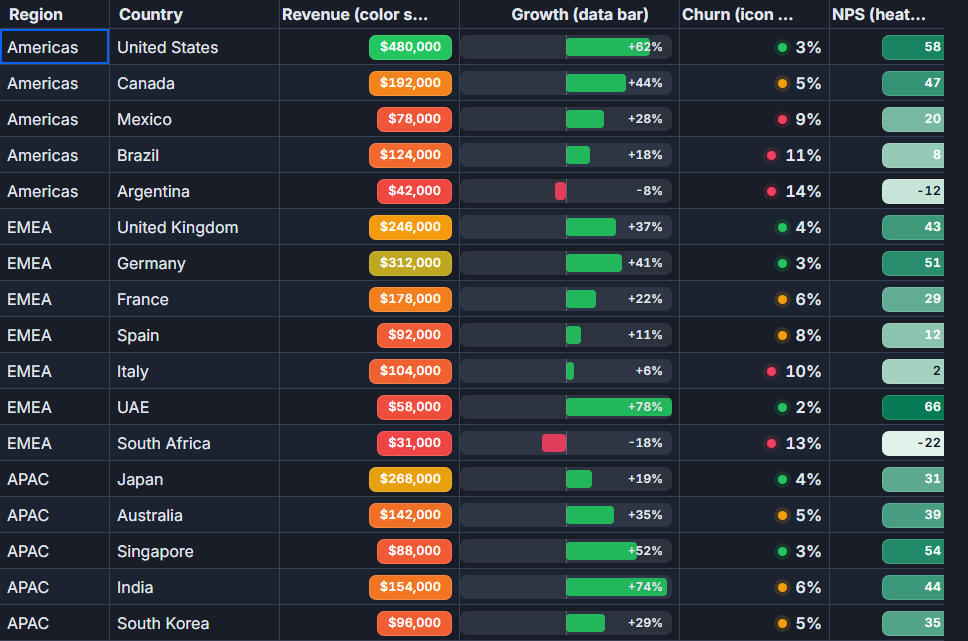
The conditionalFormats prop accepts a ConditionalFormat[] array that drives four distinct behaviors: 'rule' for predicate-based styles, 'colorScale' for gradient backgrounds, 'dataBar' for inline bar overlays, and 'iconSet' for symbol overlays. Multiple rules can target the same column at once, and they compose rather than conflict in most cases.
Picking the right rule type for the job
The choice between rule types is mostly about what the user needs to see at a glance:
- Use
'rule'when the styling is categorical: negative is red, overdue is orange, approved is green. - Use
'colorScale'when the value is continuous and you want relative magnitude to be visible - NPS, satisfaction scores, percentages. - Use
'dataBar'when absolute magnitude matters more than rank - revenue, headcount, volume. - Use
'iconSet'when direction is more important than the precise value - growth arrows, trend symbols.
They can stack. A growth column running both 'iconSet' (arrows) and 'rule' (red text on negatives) is perfectly valid and a common pattern.
Building the rule array
Here is the shape of each type before wiring them into a component. The columns array on every rule lets one definition cover multiple fields simultaneously.
import { type ConditionalFormat } from '@svgrid/grid'

type SalesRow = {
  country: string
  region: string
  revenue: number   // 0 to 500_000
  growth: number    // percentage, can be negative
  churn: number     // 0 to 15
  nps: number       // -100 to 100
  margin: number    // 0 to 60
}

const formats: ConditionalFormat<SalesRow>[] = [
  // 1. Inline bar scaled to column max across visible rows
  {
    type: 'dataBar',
    columns: ['revenue'],
    color: '#3b82f6',
  },

  // 2. Three-tier directional arrows
  //    below 0 -> down arrow, 0..9 -> sideways, 10+ -> up
  {
    type: 'iconSet',
    columns: ['growth'],
    set: 'arrows',
    thresholds: [0, 10],
  },

  // 3. Bold red text on negative growth - stacks with the icon
  {
    type: 'rule',
    columns: ['growth'],
    when: ({ value }) => Number(value) < 0,
    color: '#dc2626',
    fontWeight: 700,
  },

  // 4. Fixed-domain gradient: red (low NPS) -> yellow -> green (high NPS)
  //    minValue/maxValue pin the scale so filtering does not shift the colors
  {
    type: 'colorScale',
    columns: ['nps'],
    min: '#fca5a5',
    mid: '#fde68a',
    max: '#86efac',
    minValue: -100,
    maxValue: 100,
  },

  // 5. Alert background when churn hits a hard threshold
  {
    type: 'rule',
    columns: ['churn'],
    when: ({ value }) => Number(value) >= 12,
    background: '#fee2e2',
    color: '#991b1b',
    fontWeight: 700,
  },
]
A working regional KPI table
The complete component below wires those five rules onto a 17-row sales dataset. It also enables sorting and filtering, which interact with conditional formatting in a specific way explained after the code.
<script lang="ts">
  import {
    SvGrid,
    tableFeatures,
    rowSortingFeature,
    columnFilteringFeature,
    type ColumnDef,
    type ConditionalFormat,
  } from '@svgrid/grid'

  type SalesRow = {
    country: string
    region: string
    revenue: number
    growth: number
    churn: number
    nps: number
    margin: number
  }

  const rows: SalesRow[] = [
    { region: 'Americas', country: 'United States',  revenue: 480_000, growth:  62, churn:  3, nps:  58, margin: 42 },
    { region: 'Americas', country: 'Canada',         revenue: 192_000, growth:  44, churn:  5, nps:  47, margin: 38 },
    { region: 'Americas', country: 'Mexico',         revenue:  78_000, growth:  28, churn:  9, nps:  20, margin: 21 },
    { region: 'Americas', country: 'Brazil',         revenue: 124_000, growth:  18, churn: 11, nps:   8, margin: 19 },
    { region: 'Americas', country: 'Argentina',      revenue:  42_000, growth:  -8, churn: 14, nps: -12, margin: 12 },
    { region: 'EMEA',     country: 'United Kingdom', revenue: 246_000, growth:  37, churn:  4, nps:  43, margin: 35 },
    { region: 'EMEA',     country: 'Germany',        revenue: 312_000, growth:  41, churn:  3, nps:  51, margin: 39 },
    { region: 'EMEA',     country: 'France',         revenue: 178_000, growth:  22, churn:  6, nps:  29, margin: 28 },
    { region: 'EMEA',     country: 'Spain',          revenue:  92_000, growth:  11, churn:  8, nps:  12, margin: 22 },
    { region: 'EMEA',     country: 'Italy',          revenue: 104_000, growth:   6, churn: 10, nps:   2, margin: 17 },
    { region: 'EMEA',     country: 'UAE',            revenue:  58_000, growth:  78, churn:  2, nps:  66, margin: 47 },
    { region: 'EMEA',     country: 'South Africa',   revenue:  31_000, growth: -18, churn: 13, nps: -22, margin:  8 },
    { region: 'APAC',     country: 'Japan',          revenue: 268_000, growth:  19, churn:  4, nps:  31, margin: 33 },
    { region: 'APAC',     country: 'Australia',      revenue: 142_000, growth:  35, churn:  5, nps:  39, margin: 31 },
    { region: 'APAC',     country: 'Singapore',      revenue:  88_000, growth:  52, churn:  3, nps:  54, margin: 41 },
    { region: 'APAC',     country: 'India',          revenue: 154_000, growth:  74, churn:  6, nps:  44, margin: 26 },
    { region: 'APAC',     country: 'South Korea',    revenue:  96_000, growth:  29, churn:  5, nps:  35, margin: 32 },
  ]

  const features = tableFeatures({ rowSortingFeature, columnFilteringFeature })

  const columns: ColumnDef<typeof features, SalesRow>[] = [
    { field: 'country',  header: 'Country',   width: 160 },
    { field: 'region',   header: 'Region',    width: 110 },
    {
      field: 'revenue',
      header: 'Revenue',
      width: 200,
      align: 'right',
      format: { type: 'currency', currency: 'USD', options: { maximumFractionDigits: 0 } },
    },
    { field: 'growth',  header: 'Growth %', width: 130, align: 'right' },
    { field: 'churn',   header: 'Churn %',  width: 120, align: 'right' },
    { field: 'nps',     header: 'NPS',      width: 130, align: 'right' },
    { field: 'margin',  header: 'Margin %', width: 120, align: 'right' },
  ]

  const conditionalFormats: ConditionalFormat<SalesRow>[] = [
    { type: 'dataBar',   columns: ['revenue'], color: '#3b82f6' },
    { type: 'iconSet',   columns: ['growth'], set: 'arrows', thresholds: [0, 10] },
    { type: 'rule',      columns: ['growth'], when: ({ value }) => Number(value) < 0,
      color: '#dc2626', fontWeight: 700 },
    { type: 'colorScale', columns: ['nps'], min: '#fca5a5', mid: '#fde68a', max: '#86efac',
      minValue: -100, maxValue: 100 },
    { type: 'rule',      columns: ['churn'], when: ({ value }) => Number(value) >= 12,
      background: '#fee2e2', color: '#991b1b', fontWeight: 700 },
  ]
</script>

<SvGrid
  {features}
  {rows}
  {columns}
  {conditionalFormats}
  sortable
  filterable
  height={520}
/>
How filter and sort interact with the scales
The 'dataBar' and 'colorScale' types derive their extent from displayed rows, not the full dataset. Filter to APAC only and the revenue data bar rescales to APAC's max. That is usually what you want - relative comparisons within the visible slice.
The exception is a metric with a meaningful absolute scale. NPS runs from -100 to +100 by definition. If you let SvGrid infer the bounds from filtered rows, a view showing only strong markets will make a score of +25 look red when it should look yellow. Pinning minValue: -100, maxValue: 100 keeps the gradient anchored regardless of what the filter does.
The same logic applies to churn percentages, percentage growth, or any column where zero or 100% has semantic meaning. Pin the domain explicitly. For revenue, headcount, or anything without a natural ceiling, let SvGrid compute it from the visible data.
Two things that trip people up
The when predicate in a 'rule' receives the raw cell value before any formatting is applied. A column with format: { type: 'currency' } will still deliver 480000 as a number to when, not the string "$480,000". Wrapping with Number(value) is safe for numeric fields regardless of what the column format does.
The other common mistake is declaring the conditionalFormats array inside the component script without $derived. In Svelte 5, an array literal in <script> is stable between renders by default - but if you build the array conditionally or inside a reactive block, a new array reference on every tick will trigger a full style recomputation. At 17 rows that is negligible; at 5 000 rows it is noticeable. Declare the array as a module-level constant or inside a $derived block that only recalculates when its actual inputs change.
Extending the pattern to exported data
Conditional formatting is a visual feature - it lives in the rendered DOM, not in the data itself. When users export to CSV or Excel via api.exportCsv() or api.exportExcel(), the raw values export and the styles do not follow unless you build them into the export separately.
If you need colored Excel output, the right approach is to derive the style information from your rule logic and apply it via the Excel export options rather than trying to extract it from the grid's formatting state. The when predicates and scale logic are plain functions - they can run against the raw row array independently of the grid.
Composing rules on the same column
Two rules on the same column merge by property. The growth column above runs both 'iconSet' and 'rule' simultaneously: the icon renders as a prepended symbol and the rule overrides text color and weight. They do not conflict because they control different CSS properties.
Two 'colorScale' rules on the same column do conflict - the second one wins because it is applied last. The fix is to consolidate into a single three-stop scale using min, mid, and max together. A two-stop scale that omits mid interpolates directly between the two endpoints.
A 'rule' that sets background will override the background painted by a 'colorScale' on the same cell, because rules are merged after scale styles. This is intentional - a hard threshold alert (churn above 12%) should win over a gradient.
The runnable demo at /demos/141-conditional-formatting shows all four rule types active on a seeded random dataset with a live row count slider, so you can see the recomputation cost at different scales.