Ready-to-use bases
Each base below is one <SvBase> with sample data: the fields, the saved
views and the forms a team would set up on day one. Open the source of any of
them, replace the sample rows with your own, and it is your app's tool.
All of them share the same parts, so what works in one works in all: the table tabs (where a base has more than one table), the view bar (Hide fields, Filter, Group, Sort, Color, Row height, search), the expanded record with its changes and comments, Space on a row to open it, "+ Add row", the field editor, the selection bar for editing or deleting many rows at once, and dragging the pinned columns' edge.
Project tracker
Two tables, Tasks and Milestones. Tasks have a status, tags, an assignee, dates, an estimate, progress, a budget, files and a milestone; each milestone lists its tasks with their average progress and their budget. The tutorial builds the task table step by step.
Content calendar
Two tables, Posts and Campaigns. A post has a stage, channels, an author, a publish date, a cover image, a word count, a brief and its campaign; a campaign lists its posts and adds up their words.
- Content plan: the posts in publishing order, colored by stage, word counts summed in the footer.
- Pipeline: a Kanban by stage; dragging a card moves the post along.
- Publishing calendar: posts on their publish date; drag one to another day, or pick an empty day to schedule a new one.
- Covers: a gallery of the cover images.
- Pitch an idea: a form with the title, channels, author and brief.
Sales CRM
Three tables: Deals, Accounts and Contacts. A deal links to an account and a contact and has a stage, an owner, a value, a probability, a close date, the next step, a source and a priority. An account lists its deals and contacts and rolls up its pipeline value; a contact lists its deals.
- All deals: biggest first, colored by stage; the footer sums the value and averages the probability.
- Pipeline: a Kanban by stage.
- Closing calendar: deals on their close date.
- Open deals by owner: grouped by owner, Won and Lost filtered out; each group shows its own totals.
- New lead: a form that starts a deal in the Lead stage.
Linking a deal to an account lists it on the account, and the other way round. Hover a chip to preview the account, click it to open it ("Open in Accounts" goes there), and create a new account from the link picker.
Product roadmap
Two tables, Features and Feedback. A feature has a quarter, a status, teams, a lead, impact, effort in days, start and target dates, customer votes and a spec link; each customer request links to the feature it is about, and the feature counts them.
- Roadmap by quarter: grouped by quarter, highest impact first, each group with its effort and votes; "+" in a group adds a feature to that quarter.
- Status board: a Kanban by status.
- Timeline: each feature from its start to its target date.
- Now: in progress, in beta or blocked, by target date.
- Request a feature: a form for anyone in the company.
Hiring tracker
Two tables, Candidates and Roles. A candidate has a photo, a role, a stage, a recruiter, a rating, the interview date, the salary ask, an email, a resume, the source and notes; a role has its team, hiring manager and headcount, and lists its candidates.
- Hiring pipeline: a Kanban by stage.
- All candidates: best rated first, colored by stage.
- Faces: a gallery of the photos.
- Interviews: a calendar of interview dates.
- Apply: the form a candidate fills in, with their resume.
Inventory
Two tables, Items and Suppliers. An item has photos, a category, a location,
a supplier, the quantity, the unit cost, the stock value (a formula,
{Qty} * {Unit cost}), the condition, who has it checked out, when it was
last counted and a barcode; a supplier lists its items and the units in
stock.
- Stock by category: grouped by category, the footer and each group summing quantity and value.
- Photos: a gallery.
- By location: a Kanban by location; dragging an item moves it.
- Reorder: three or fewer in stock, red at zero and amber below four.
- Add an item: a form.
Bug tracker
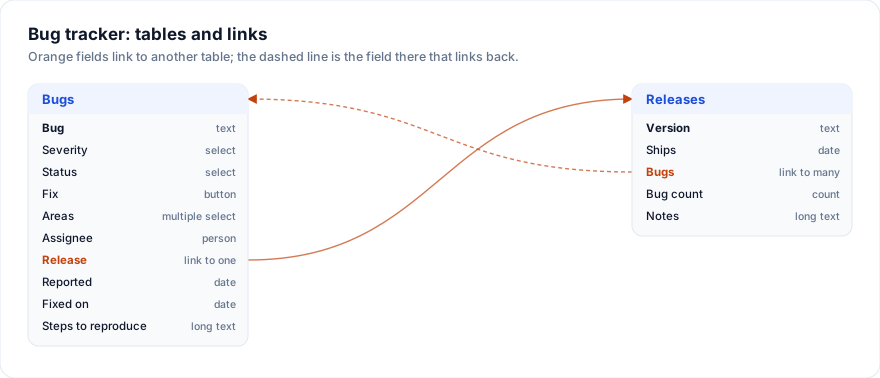
Two tables, Bugs and Releases. A bug has a severity, a status, the areas it touches, who reported it and who is on it, the release it ships in, the steps to reproduce, and when it was reported and fixed. A release lists its bugs and counts them.
- Triage: grouped by status, colored by severity.
- Board: a Kanban by status.
- Critical now: critical bugs that are not fixed.
- Bugs by area: a bar chart.
- Report a bug: the form anyone can fill in.
Automations: a critical bug that is not fixed turns red and raises a notice; setting Status to Fixed stamps "Fixed on"; a bug from the form starts as New; Start in the Fix column moves a bug to In progress.
Event planning
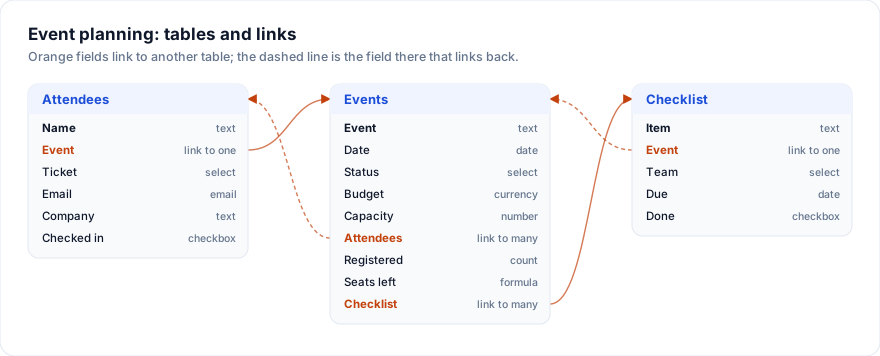
Three tables: Events, Attendees and Checklist. An event has a date, a venue,
a status, an owner, a budget and a capacity; it counts who registered and
works out the seats left ({Capacity} - {Registered}). Attendees have a
ticket type and check in on the day; checklist items have a team and a due
date.
- Calendar: events on their date, colored by status.
- Planning board: a Kanban by status.
- Guest list: attendees grouped by event.
- Tickets by type: a donut.
- RSVP: the form a guest fills in.
Automations: an event that turns Confirmed gets its checklist (three items created in Checklist and linked back to it); an event with no seats left turns red and raises a notice, also when the last seat goes from the Attendees table; a guest who RSVPs is told they are in.
OKRs
Open the live example: OKRs (Base)
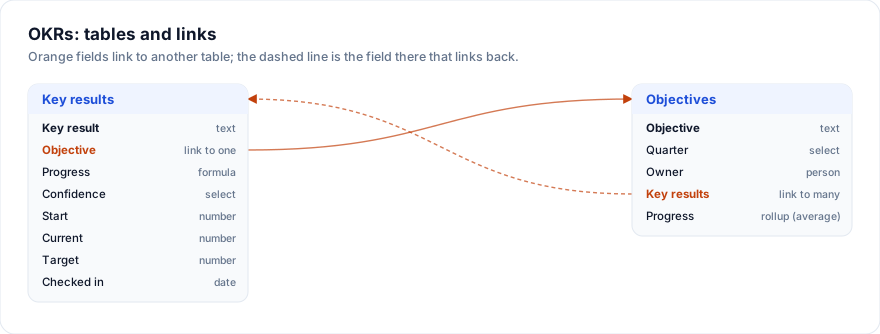
Two tables, Key results and Objectives. A key result measures something from
a start value to a target; its progress is a formula,
MAX(0, MIN(1, ({Current} - {Start}) / ({Target} - {Start}))), and its
confidence says whether it will get there. An objective has a quarter and an
owner, and averages the progress of its key results with a rollup.
- By objective: key results grouped by objective, colored by confidence.
- Confidence: a Kanban.
- Weekly check-in: the numbers to update, least recently checked first.
- Progress by objective: a bar chart of the rollup.
Automations: a key result that falls Off track turns red and raises a notice; one that reaches its target is marked Achieved.
Expense approvals
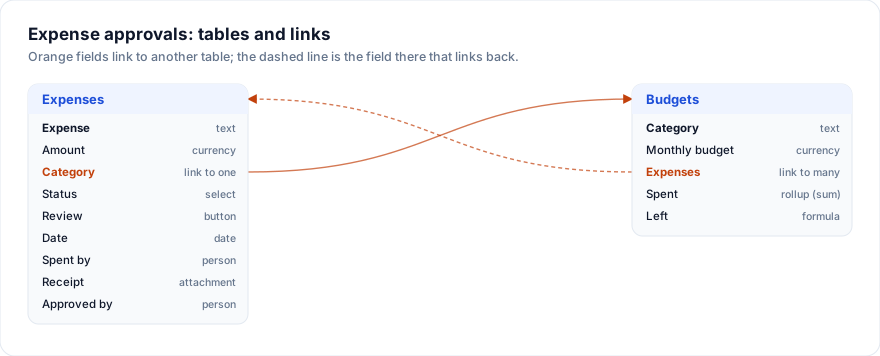
Two tables, Expenses and Budgets. An expense has an amount, a category, a date, who spent it, a receipt, a status from Draft to Paid, and who approved it and when. A budget category lists its expenses, adds up what was spent (a rollup) and shows what is left (a formula over the rollup).
- This month: newest first, colored by status, totals in the footer.
- Approvals: a Kanban by status.
- Spend by category: a pie of the amounts.
- Receipts: a gallery.
- Submit an expense: the form.
Automations: an expense over $1,000 goes to Needs approval; Approve in the Review column approves it and records who and when; a rejected expense turns red; one sent with the form starts as Submitted; a category over its budget raises a notice.
Employee onboarding
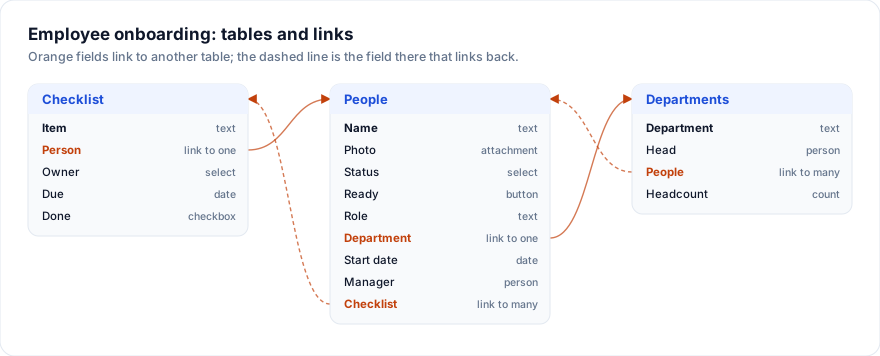
Three tables: People, Checklist and Departments. A person has a photo, a role, a department, a manager, a start date and a status; checklist items have an owner (IT, HR or the manager) and a due date; departments list their people and count them.
- Pipeline: a Kanban by status.
- Photo directory: a gallery.
- Start dates: a calendar.
- By department: grouped by department.
- Add a new hire: the form.
Automations: a new hire, from "+ Add row" or the form, gets a checklist: three items for IT, HR and their manager, created in Checklist and linked back. Someone starting within a week has their start date colored, and Activate in the Ready column marks them Active.
Start from your own database
Every template here is also a database. npm create @svgrid@latest my-base -- -t base offers each one by name and writes it as SQL to db/schema.sql,
with its records, views and automations, on Postgres in the browser, your
own Postgres or Supabase (From a database to an app):
npm create @svgrid@latest my-base -- -t base --data supabase --sample bug-tracker
The names: project-tracker, sales-crm, content-calendar,
product-roadmap, hiring-tracker, inventory, bug-tracker,
event-planning, okrs, expenses, onboarding. A base you changed
here goes the same way: "All tables", then Download as SQL.
Live examples
- Content calendar - An editorial content calendar, ready to use: Posts and Campaigns as two linked tables. Posts have stage, channels, author, publish date, cover and brief. Views for the plan, the pipeline as a Kanban, the publishing calendar, a wall of covers and a pitch form.
- Sales CRM - A sales CRM, ready to use: Deals, Accounts and Contacts as three linked tables. Link a deal to an account and the account lists it. Views for all deals, the pipeline as a Kanban, the closing calendar, open deals by owner and a new-lead form.
- Product roadmap - A product roadmap, ready to use: Features and customer Feedback as two linked tables. Features have quarter, status, teams, lead, impact, effort and votes. Views for the roadmap grouped by quarter, a status board, a timeline, the work in progress now and a request form.
- Hiring tracker - A hiring tracker, ready to use: Candidates and Roles as two linked tables. Candidates have photo, role, stage, recruiter, rating, interview date and resume; each role lists its candidates. Views for the pipeline as a Kanban, all candidates, a gallery of faces, interviews and an application form.
- Inventory - An inventory, ready to use: Items and Suppliers as two linked tables. Items have photos, category, location, quantity, unit cost and a stock value formula; each supplier lists its items and units in stock. Views for stock by category, photos, items by location, a reorder list and an add-item form.
- Bug tracker - A bug tracker, ready to use: Bugs and Releases as two linked tables. Bugs have severity, status, areas, reporter, assignee, release and steps to reproduce. Views for triage, a board by status, what is critical now, bugs by area and a report form, with automations that flag critical bugs and stamp fix dates.
- Event planning - Event planning, ready to use: Events, Attendees and a Checklist as linked tables. Events count who registered and the seats left. Views for the calendar, a planning board, the guest list, tickets by type and an RSVP form, with automations that build a checklist for a confirmed event and flag a full one.
- OKRs - Objectives and key results, ready to use: key results measure progress from start to target with a formula, and each objective averages them with a rollup. Views by objective, a confidence board, a weekly check-in and progress by objective, with automations for off-track and achieved results.
- Expense approvals - Expense approvals, ready to use: Expenses and Budgets as linked tables, with receipts, approval statuses and what is left of each budget. Views for this month, an approvals board, spend by category, receipts and a submit form, with automations that route big expenses for approval and an Approve button.
- Employee onboarding - Employee onboarding, ready to use: People, their Checklist and Departments as linked tables. Views for the hiring pipeline, a photo directory, start dates on a calendar and a new hire form, with an automation that creates the checklist for IT, HR and the manager of each new hire.