What's New in SvGrid Enterprise - Export, Pivot, Import, Print, and AI
A practical look at @svgrid/enterprise - pivot tables, Excel and PDF export, data import, printing, and an AI assistant. Covers when each feature earns its place and what to watch out for in production.
The moment a product manager asks for "an Excel export button" is the moment you realize Community grids have a ceiling. @svgrid/enterprise exists to push that ceiling much higher without making you build export pipelines, pivot engines, or print layouts from scratch. This post covers every major feature in the Enterprise package, with honest notes about where each one shines and where it has limits.
Getting enterprise loaded
One call registers the entire Enterprise feature set into the SvGrid runtime:
// app.ts or +layout.ts - runs once before any grid mounts
import { installEnterprise, setLicenseKey } from '@svgrid/enterprise'

setLicenseKey('YOUR-LICENSE-KEY')
installEnterprise()
That placement matters. installEnterprise() mutates the shared SvGrid registry, so it must fire before any <SvGrid> component renders. Putting it inside onMount inside a child component is the most common mistake - grids that hydrate during SSR or mount before that component initializes will silently fall back to Community behavior with no error thrown.
For evaluation, 'SVENTERPRISE-DEV-DEMO' is a valid key. It renders a watermark in the grid header and is blocked from production builds (the package checks NODE_ENV at build time).
Pivot tables - client-side OLAP on flat data
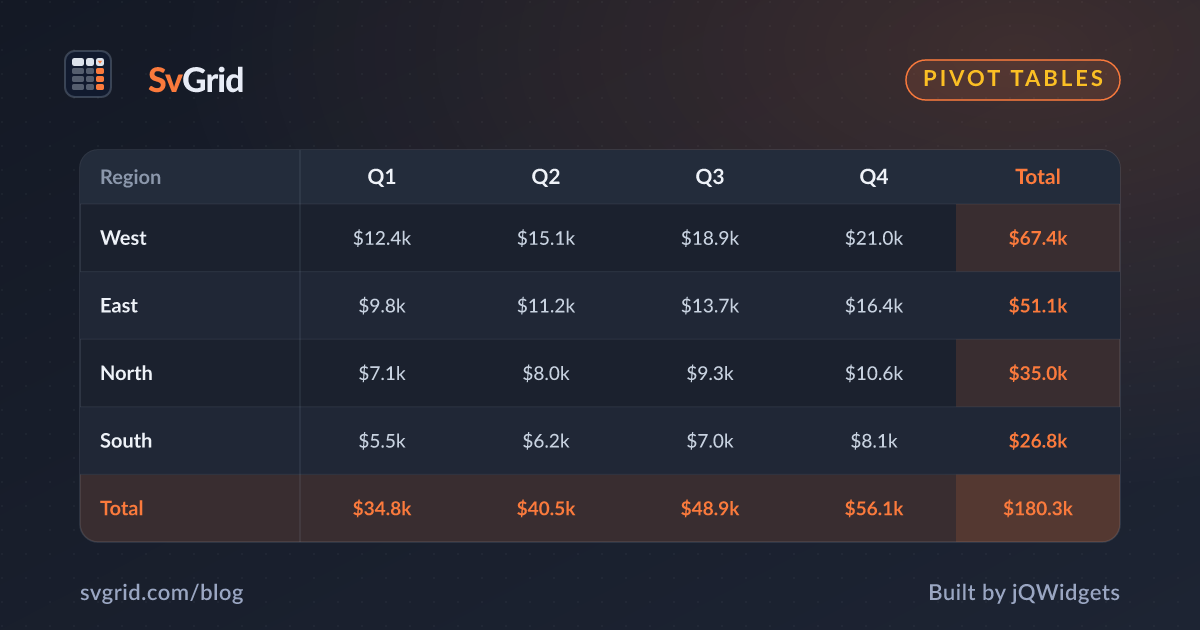
The pivot feature is the most complex thing in the Enterprise package, and also the one that saves the most engineering time. createPivotModel takes your flat array plus a reactive PivotLayout and produces aggregated cross-tab rows for the grid to render. When the layout changes - because the user dragged a dimension or swapped a measure - the grid recomputes reactively without a full remount.
<script lang="ts">
  import SvGrid, {
    tableFeatures,
    rowSortingFeature,
    type SvGridApi,
  } from '@svgrid/grid'
  import {
    createPivotModel,
    filterCollapsedPivotRows,
    SvPivotDesigner,
    defaultLayoutFor,
    type PivotField,
    type PivotLayout,
    type EnterpriseGridApi,
  } from '@svgrid/enterprise'

  type Row = {
    region: 'Americas' | 'EMEA' | 'APAC'
    category: string
    quarter: 'Q1' | 'Q2' | 'Q3' | 'Q4'
    revenue: number
    profit: number
    units: number
  }

  // rows is your flat dataset - could come from a fetch or $state
  const rows: Row[] = []  // populated at runtime

  const fields: PivotField<Row>[] = [
    { field: 'region',   label: 'Region',   kind: 'dimension' },
    { field: 'category', label: 'Category', kind: 'dimension' },
    { field: 'quarter',  label: 'Quarter',  kind: 'dimension' },
    {
      field: 'revenue',
      label: 'Revenue',
      kind: 'measure',
      defaultAgg: 'sum',
      format: { type: 'currency', currency: 'USD', options: { maximumFractionDigits: 0 } },
    },
    {
      field: 'profit',
      label: 'Profit',
      kind: 'measure',
      defaultAgg: 'sum',
      format: { type: 'currency', currency: 'USD', options: { maximumFractionDigits: 0 } },
    },
  ]

  // defaultLayoutFor builds a reactive PivotLayout from field definitions
  let layout = $state<PivotLayout>(defaultLayoutFor(fields, {
    rows: ['region', 'category'],
    cols: ['quarter'],
    values: ['revenue', 'profit'],
  }))

  let api = $state<(SvGridApi & EnterpriseGridApi) | null>(null)
</script>

<!-- SvPivotDesigner is a drag-and-drop layout editor -->
<SvPivotDesigner {fields} bind:layout />

<SvGrid
  data={rows}
  rowModel={createPivotModel({ layout, rows, fields, filterFn: filterCollapsedPivotRows })}
  features={tableFeatures([rowSortingFeature])}
  onApiReady={(g) => { api = g as SvGridApi & EnterpriseGridApi }}
/>
createPivotModel is not compatible with createServerDataSource. Pivot aggregation runs on the client from a complete flat array - if your data lives behind a paginated API, fetch the full relevant dataset first, then pass it to createPivotModel. Mixing server pagination with client pivot silently sums a partial dataset with no warning.
Also worth knowing: PivotLayout is Svelte 5 reactive state internally. Do not serialize it with JSON.stringify for persistence - call layout.serialize() instead, which strips computed internal fields before writing to localStorage or your API.
Export - XLSX, CSV, and PDF
Export is triggered through the EnterpriseGridApi surface that intersects with SvGridApi after onApiReady fires:
// Export respects the current view - hidden columns are excluded
api.exportData({ format: 'xlsx', fileName: 'report.xlsx' })
api.exportData({ format: 'csv',  fileName: 'report.csv' })
api.exportData({ format: 'pdf', fileName: 'report.pdf', title: 'Q2 Sales Report' })
All three formats respect the current view state: visible columns only, current sort order, current filter results. If a column was hidden by the user, it is absent from the export. If your export must always include certain columns regardless of user preference, restore them before triggering:
async function exportWithRequiredColumns() {
  const wasVisible = api.isColumnVisible('internal_id')
  if (!wasVisible) api.setColumnVisible('internal_id', true)

  await api.exportData({ format: 'xlsx', fileName: 'full-report.xlsx' })

  if (!wasVisible) api.setColumnVisible('internal_id', false)
}
XLSX export lazy-loads SheetJS (~180 KB gzipped) on first use. A grid that never exports never pays that cost. PDF export is a separate code path - it renders the current view into a headless canvas, then encodes it as a PDF. It does not use SheetJS and has no dependency on the browser's print dialog, but it has a hard limit of 10,000 displayed rows. Beyond that, exportData throws EnterpriseExportLimitError. For large datasets, use XLSX, which has no row limit within the package.
Print layout
Print builds a dedicated DOM subtree that mirrors the visible rows with repeated <thead> elements across page breaks, then calls window.print(). It does not use the browser's built-in print rendering of the live grid DOM, which means column widths, frozen columns, and cell formatting are all preserved across pages.
api.print({
  repeatHeaders: true,
  pageBreakField: 'region',   // inserts a page break before each new value in this field
  title: 'Sales by Region',
  fitColumns: true,           // scales column widths to fit paper width
})
pageBreakField is the option I reach for most often in reporting scenarios - if your data is grouped by region or department, each section starts on a new page automatically.
Data import
Import handles CSV and XLSX files dropped onto the grid or selected via a file picker. The Enterprise API validates column headers against your column definitions and returns a diff rather than immediately committing rows, giving users a chance to review what will change:
const result = await api.importData({
  file: fileFromInput,
  format: 'xlsx',         // or 'csv' - autodetected if omitted
  matchBy: 'field',       // match columns by field name, not header label
  validateRows: true,     // runs your column validators before returning
})

// result.valid: rows that passed validation
// result.invalid: rows with validation errors and the reasons
// result.unchanged: rows already present with identical values

if (result.invalid.length === 0) {
  api.applyTransaction({ add: result.valid, update: result.updated })
} else {
  // show a diff UI before committing
  showImportReview(result)
}
The two-phase import pattern (validate, then commit via applyTransaction) is deliberate. It lets you build a review step without rolling your own diff logic.
AI assistant
The AI assistant connects to the SvGrid MCP server and operates on snapshots from api.getData(). It cannot mutate grid state directly - it proposes filter, grouping, and sort configurations in a structured format, which the user confirms before anything is applied. The actual mutations go through api.setFilter, api.setGroupBy, and api.setSort, so everything the AI proposes is subject to the same validation as user-driven changes.
In practice, the most useful AI interactions are the ones that would otherwise require a user to know the exact filter syntax: "show me rows where revenue dropped more than 20% quarter over quarter" is a query that translates naturally to a compound filter definition, but requires knowing both the filter API and the data shape. The AI assistant handles that translation.
Choosing between Community and Enterprise
Community covers the full view and edit surface: sort, filter, column management, grouping, cell editing, row selection, pagination, virtualization, server-side data, and custom cell renderers. If your users work with data entirely inside the grid, Community is sufficient and is free for commercial use.
Enterprise earns its price the first time any of these come up:
- A stakeholder asks for an Excel or PDF export
- You need pivot/cross-tab aggregations without building your own aggregation engine
- Users need to import and validate CSV or XLSX files
- You need print-ready paginated output with repeated headers
Each of those features represents at least a week of engineering time to build correctly, with all the edge cases around column visibility, formatting, and large datasets. The license covers all of them together.
The licensing tiers: Single Application ($599 perpetual, one production app) and Multiple Application ($999 perpetual, unlimited apps at your organization). Both include one year of updates, with opt-in renewal.
Live demos for the features covered here: /demos/60-pivot-expandable, /demos/168-pivot-designer, /demos/124-pivot-olap.