What Makes a Svelte Data Grid Fast (and How to Measure It)
Performance claims are easy to make. Here is how to actually measure grid speed - what metrics matter, what traps to avoid, and what the fundamentals look like in code.
Most "fastest grid" posts are marketing. This one is not. If you need to pick a Svelte data grid and performance is on your list of requirements, here is what to measure, why naive benchmarks mislead you, and what actually separates a fast grid from a slow one.
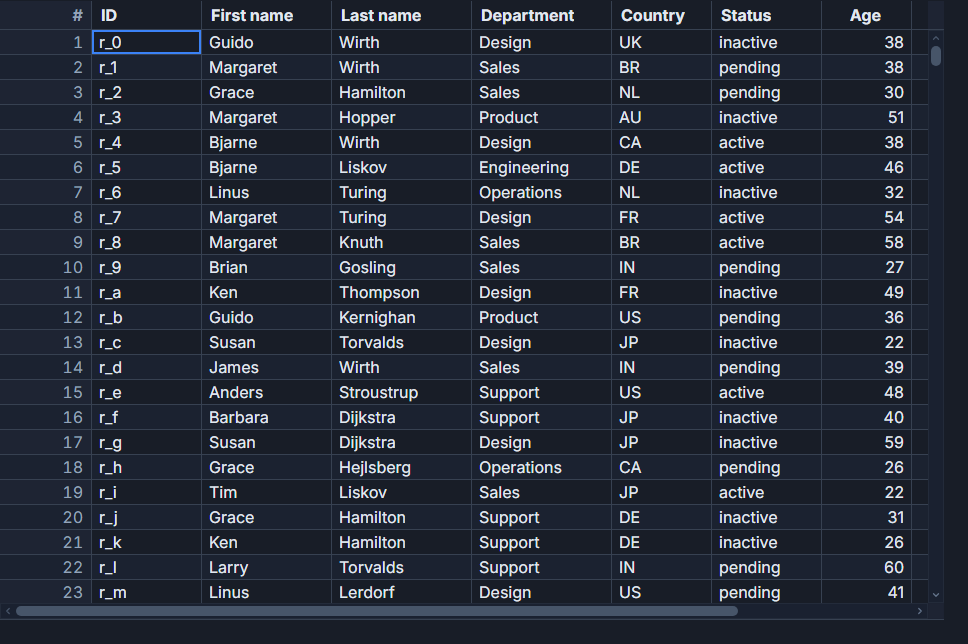 A million-row dataset in SvGrid, kept smooth by virtualization.
The three things that actually determine speed
Grid performance comes down to three independent problems, and a grid can be good at one while being terrible at the others.
Virtualization. This is the most important one. A grid that renders 100,000 rows to the DOM is not a data grid - it is a crash waiting to happen. Real virtualization keeps the number of rendered rows constant regardless of dataset size, typically in the range of visible rows plus a small overscan buffer. Row virtualization is table stakes; column virtualization matters once you have more than ~30 columns.
Update cost. How expensive is it to change a cell value or apply a batch of updates? Virtual-DOM grids have to diff the entire rendered tree on each update. Svelte 5's fine-grained reactivity eliminates that: each cell tracks its own dependencies and only the affected cells repaint. The difference is invisible at 100 rows and dramatic at 10,000.
Pipeline overhead. Sort, filter, group - these transformations run on every state change. A well-designed grid sorts once per change and reuses the result; a poorly designed one sorts inside the render function and throws it away. With large datasets this is the thing that makes UI interactions feel laggy even when the DOM work is fast.
Setting up a meaningful benchmark
If you want to compare grids seriously, here is the minimal setup that gives you honest results.
Same data, same columns, production builds, same browser, same machine. Run on a mid-range laptop with CPU throttled to 4x in DevTools - that is where differences are visible. Average at least five runs per scenario.
The scenarios worth measuring:
- Initial render: time from data load to interactive. Use the browser's Performance panel, not
Date.now(). - Scroll frame budget: scroll from top to bottom, check the main thread for frames over 16ms.
- Live update throughput: apply 1,000 cell updates per second and measure jank.
- Sort/filter latency: time from user click to repaint on a 50,000-row dataset.
Here is a minimal SvGrid setup you can use as a baseline for your own benchmark:
<script lang="ts">
  import SvGrid from '@svgrid/grid'
  import {
    tableFeatures,
    rowSortingFeature,
    columnFilteringFeature,
    rowSelectionFeature,
    rowPaginationFeature,
    type ColumnDef,
    type SvGridApi,
  } from '@svgrid/grid'

  // Generate a realistic dataset
  const ROW_COUNT = 50_000
  const rows = Array.from({ length: ROW_COUNT }, (_, i) => ({
    id: i,
    name: `Row ${i}`,
    value: Math.random() * 1000,
    category: ['A', 'B', 'C', 'D'][i % 4],
    status: i % 3 === 0 ? 'active' : 'inactive',
    score: Math.round(Math.random() * 100),
  }))

  const features = tableFeatures({
    rowSortingFeature,
    columnFilteringFeature,
    rowSelectionFeature,
    rowPaginationFeature,
  })

  const columns: ColumnDef<typeof features, (typeof rows)[0]>[] = [
    { id: 'id',       field: 'id',       header: 'ID',       width: 80  },
    { id: 'name',     field: 'name',     header: 'Name',     width: 180 },
    { id: 'value',    field: 'value',    header: 'Value',    width: 120, type: 'number' },
    { id: 'category', field: 'category', header: 'Category', width: 120 },
    { id: 'status',   field: 'status',   header: 'Status',   width: 120 },
    { id: 'score',    field: 'score',    header: 'Score',    width: 100, type: 'number' },
  ]

  let api: SvGridApi | undefined

  // Mark render complete for timing
  $effect(() => {
    if (api) {
      performance.mark('grid-ready')
    }
  })
</script>

<SvGrid
  data={rows}
  {columns}
  sortable
  filterable
  virtualization={true}
  rowHeight={30}
  onApiReady={(a) => { api = a }}
/>
Run that, open the Performance panel, record a sort click on a column, and look at the resulting flame chart. That tells you far more than any published benchmark.
The update scenario most benchmarks skip
Scroll and initial render get all the attention. Live updates are where production apps actually hurt.
Consider a trading dashboard or a monitoring view where hundreds of cells change per second. The naive approach - mutate the data array and let the grid re-render - forces the grid to re-evaluate every visible cell on every tick.
SvGrid handles this through applyTransaction, which accepts explicit add/update/remove lists and only repaints affected cells:
import type { SvGridApi } from '@svgrid/grid'

// Simulate a live feed applying 200 changes every 100ms
function startFeed(api: SvGridApi) {
  setInterval(() => {
    const updates = Array.from({ length: 200 }, () => ({
      id: Math.floor(Math.random() * 50_000),
      value: Math.random() * 1000,
      score: Math.round(Math.random() * 100),
    }))

    api.applyTransaction({ update: updates })
  }, 100)
}
At 200 updates per 100ms (2,000/sec), a grid without surgical update support will visibly stutter on mid-range hardware. The right thing to measure here is not "does it work" but "what is the 99th-percentile frame time under sustained load."
What conditional formatting costs you
One performance foot-gun that rarely gets benchmarked: conditional formatting functions run on every cell during render. If they are expensive, they show up everywhere.
import { type ColumnDef } from '@svgrid/grid'

// Cheap: pure value comparison
const scoreColumn: ColumnDef<typeof features, Row> = {
  id: 'score',
  field: 'score',
  header: 'Score',
  width: 100,
  type: 'number',
  conditionalFormat: [
    { condition: ({ value }) => value < 40,  style: { color: 'var(--red)',   fontWeight: 'bold' } },
    { condition: ({ value }) => value >= 80, style: { color: 'var(--green)', fontWeight: 'bold' } },
  ],
}

// Expensive: avoid anything that allocates or accesses external state per cell
// Bad:
// conditionalFormat: [{ condition: ({ value, row }) => expensiveRankLookup(row), style: {...} }]
The condition function gets called for every visible cell on every render cycle. Keep it a pure value comparison. If you need something more complex, precompute a lookup when the data changes and close over it.
Server-side data and where virtualization changes
The setup above assumes client-side data. If you are loading from a server, the performance model is different: you are not virtualizing 50,000 local rows, you are paging through a server-side cursor. SvGrid's createServerDataSource handles the wiring:
import { createServerDataSource } from '@svgrid/grid'

const ds = createServerDataSource({
  fetch: async ({ page, pageSize, sort, filters }) => {
    const params = new URLSearchParams({
      page: String(page),
      size: String(pageSize),
    })

    if (sort.length > 0) {
      params.set('sortField', sort[0].id)
      params.set('sortDir', sort[0].desc ? 'desc' : 'asc')
    }

    for (const f of filters) {
      params.set(`filter_${f.id}`, JSON.stringify(f.value))
    }

    const res = await fetch(`/api/rows?${params}`)
    const json = await res.json()
    return { rows: json.data, total: json.total }
  },
})
In this mode, render performance is almost irrelevant - you are rarely showing more than a few hundred rows at once. What matters is request latency, debounce on filter input, and avoiding redundant fetches. Profile the network tab, not the flame chart.
Reading the flame chart
When you do record a Performance trace, look for these patterns:
- Long tasks on sort/filter: the pipeline is not caching the sorted result.
- Many small Svelte update tasks on scroll: virtualization is working but row recycling is expensive - check if custom cell snippets are doing unnecessary work.
- Flat main thread during bulk updates: good sign that surgical updates are working correctly.
- Paint calls on every keypress in a filter input: the grid is re-rendering on every keystroke rather than debouncing.
No grid, including SvGrid, will have a perfect flame chart on every workload. The goal is understanding where the time goes so you can decide whether it matters for your specific case.
An honest take on published benchmarks
Published "fastest grid" benchmarks are almost always produced by the grid vendor. That is not necessarily dishonest - vendors know their product and can set it up optimally - but it does mean the comparison grids are often configured suboptimally or measured in scenarios where the vendor's approach happens to shine.
The only benchmark that matters for your project is the one you run on your actual data, your actual columns, your actual update patterns, on the hardware your users have. Set that up, measure the candidates, and pick the one that wins on the metrics your app cares about.
SvGrid's approach - Svelte 5 runes for surgical cell updates, row and column virtualization on by default, and a headless pipeline that separates data transformation from rendering - is designed to be fast across all three dimensions, not just one. Test it against your workload and see where it lands.