Avoiding Layout Thrash in Custom Grid Cells
Layout thrash from interleaved DOM reads and writes is the most common cause of scroll jank in grids with custom cells - here is how to find it and design your way out of it.
Scroll performance in a data grid falls apart in a very specific way. Everything looks fine in isolation - one cell renders fast, animations look smooth - but as soon as a few hundred rows are virtualized and scrolling, the frame rate drops to the low twenties. The culprit is almost always layout thrash: a pattern where the browser is forced to recompute layout repeatedly inside a single frame because JavaScript reads layout properties and writes DOM styles in the wrong order.
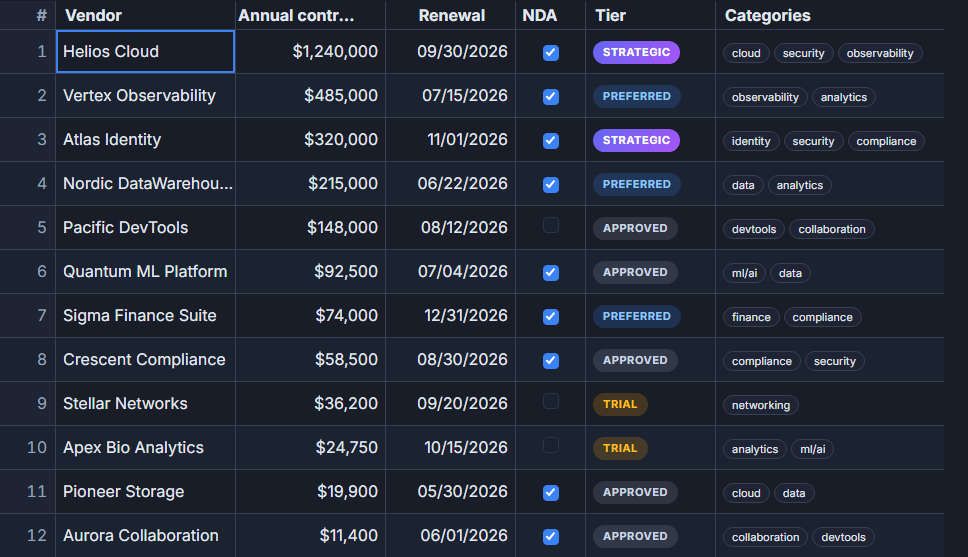 Custom cell types render inside the virtualizer - each visible cell is a real DOM node.
What the browser actually does
The browser is lazy about layout computation. When you mutate styles, it queues the work and waits until it actually needs the result. "Actually needs" means: either the frame is about to paint, or JavaScript reads a layout-dependent property like offsetWidth, getBoundingClientRect, scrollHeight, or clientTop.
When you read one of those properties after writing to the DOM, the browser has no choice - it has to flush its pending style mutations and recompute layout before it can hand you a number. Do that inside a loop and you get one full reflow per iteration instead of one per frame. In a grid with 50 visible rows and 10 columns, that is 500 forced reflows per scroll event.
The tell-tale sign in DevTools is a purple "Layout" bar that fires repeatedly inside a single long task, often inside "Recalculate Style". Chrome will also print "Forced reflow while executing JavaScript" in the console when it detects this.
Where it shows up in custom cells
The pattern almost never comes from the grid itself - it comes from code inside custom cell renderers. A few common sources:
Tooltip positioning. The cell renders, measures its own position with getBoundingClientRect, then writes the tooltip coordinates. If this happens on every render cycle for every visible cell, you have 50+ getBoundingClientRect calls interleaved with DOM writes.
Dynamic truncation. A cell checks el.scrollWidth > el.offsetWidth to decide whether to show a "read more" link. If it does this on mount for every visible cell, every cell mount triggers a forced reflow.
Sparkline or chart sizing. A miniature chart inside a cell reads the cell's clientWidth to set the SVG viewBox. Called once per visible cell on each virtualization scroll, this stacks up fast.
Designing cells that do not thrash
The fix is not just "batch reads before writes" - that is a surgical patch for imperative code. The more durable solution is to write custom cells that do not need to read the DOM at all during render.
Use CSS instead of measurement. Most "I need to know this cell's size" problems are really layout problems that CSS can handle. If a cell contains an image and needs to maintain an aspect ratio, use aspect-ratio: 16/9 rather than reading offsetHeight and setting offsetWidth. If text needs truncation, use text-overflow: ellipsis with overflow: hidden on a fixed-width container rather than comparing scrollWidth to offsetWidth.
Here is a cell snippet that handles both:
<!-- statusCell.svelte - snippet for a status badge with truncated label -->
{#snippet statusCell({ value, row })}
  <span
    class="cell-status"
    class:active={value === 'active'}
    class:warn={value === 'pending'}
    title={value}
  >
    {value}
  </span>
{/snippet}

<style>
  .cell-status {
    display: inline-block;
    max-width: 100%;
    overflow: hidden;
    text-overflow: ellipsis;
    white-space: nowrap;
    padding: 2px 8px;
    border-radius: var(--sg-radius, 4px);
    font-size: 0.8em;
    background: color-mix(in srgb, currentColor 10%, transparent);
  }

  .cell-status.active { color: #22c55e; }
  .cell-status.warn   { color: #f59e0b; }
</style>
No offsetWidth read. No style mutation at render time. The browser handles truncation with a single CSS property, and the title attribute gives users the full value on hover.
Measure once, on demand - not per cell. When measurement is unavoidable (tooltip positioning, popover anchoring), measure at the moment the user interacts, not at cell render time. A tooltip should fire getBoundingClientRect when the user hovers, not when the cell mounts.
<!-- tooltipCell - measures only on hover, not on render -->
{#snippet tooltipCell({ value, row })}
  <span
    class="cell-with-tip"
    onmouseenter={(e) => showTooltip(e.currentTarget, value)}
    onmouseleave={hideTooltip}
  >
    {value}
  </span>
{/snippet}

<script lang="ts">
  let tooltipEl: HTMLElement | null = null

  function showTooltip(anchor: Element, content: string) {
    // single getBoundingClientRect, on demand, triggered by user action
    const rect = anchor.getBoundingClientRect()
    if (!tooltipEl) return
    tooltipEl.style.top  = `${rect.bottom + window.scrollY + 4}px`
    tooltipEl.style.left = `${rect.left + window.scrollX}px`
    tooltipEl.textContent = content
    tooltipEl.hidden = false
  }

  function hideTooltip() {
    if (tooltipEl) tooltipEl.hidden = true
  }
</script>
One read, one write, triggered by an event - not stacked across 50 cells on every scroll.
The tricky case: cells that resize with column width
Virtualized grids resize cells when columns are resized. If a custom cell reacts to its own width - for example, a miniature bar chart that scales to fill the cell - you need a resize observer, not inline measurement.
The right pattern is a single shared observer at the column level, not an observer per cell:
<script lang="ts">
  import SvGrid from '@svgrid/grid'
  import type { ColumnDef } from '@svgrid/grid'

  let { data, columns } = $props<{
    data: Row[],
    columns: ColumnDef<typeof features, Row>[]
  }>()

  // column-level width tracked via ResizeObserver on the header cell
  let chartWidth = $state(120)

  function observeColumnWidth(headerEl: HTMLElement) {
    const ro = new ResizeObserver(([entry]) => {
      chartWidth = entry.contentRect.width
    })
    ro.observe(headerEl)
    return () => ro.disconnect()
  }
</script>

{#snippet sparkCell({ value })}
  <!--
    uses $derived chartWidth, set once per column resize,
    not measured inside the cell on each render
  -->
  <svg width={chartWidth} height={28} viewBox={`0 0 ${chartWidth} 28`}>
    {#each value as v, i}
      <rect
        x={i * (chartWidth / value.length)}
        y={28 - v * 0.28}
        width={chartWidth / value.length - 1}
        height={v * 0.28}
        fill="var(--sg-accent)"
      />
    {/each}
  </svg>
{/snippet}
One observer fires once per resize event. All visible cells share the chartWidth reactive variable and re-render with the updated value without touching the DOM for measurement themselves.
What "batch reads before writes" looks like in practice
If you do have imperative code that reads layout properties - say, a post-render pass that checks overflow on a set of cells and adds indicators - structure it as two explicit phases:
// This pattern appears in cell post-processing, not in the cell snippet itself.
// Called once after the grid paints, NOT on every cell mount.
function markOverflowingCells(cells: HTMLElement[]) {
  // phase 1: all reads (one reflow)
  const flags = cells.map((el) => el.scrollWidth > el.clientWidth)

  // phase 2: all writes (no additional reflow)
  cells.forEach((el, i) => {
    if (flags[i]) el.setAttribute('data-overflow', 'true')
  })
}
The key is that this runs once after paint - not inside the cell render function and not on scroll.
Checking your work
Chrome DevTools Performance panel is the authoritative source. Record while scrolling, look at long tasks in the main thread flame chart. Repeated "Recalculate Style" and "Layout" bars firing inside a single task are the sign. The "Layout Shift" row in the Experience track catches cumulative shifts from layout mutations.
For quick sanity checking during development, performance.mark / performance.measure around the section you suspect is enough to isolate the problem without a full recording. A smooth 60fps scroll through 100k rows is achievable - forced reflow from custom cells is usually what stands between a good implementation and that target.