Aggregation Functions Explained (Sum, Avg, Min, Max, Count)
A practical look at SvGrid's five built-in aggregations - what they compute, where the math quietly breaks, and how to handle the server-paged case where client totals are meaningless.
Five aggregation functions: sum, avg, min, max, count. Every dashboard ever built reduces to some combination of those five. The interesting part is not the arithmetic - that is trivial. The interesting part is which rows go into the fold, and how the answer changes when the user applies a filter, navigates to page 3, or groups by two columns at once.
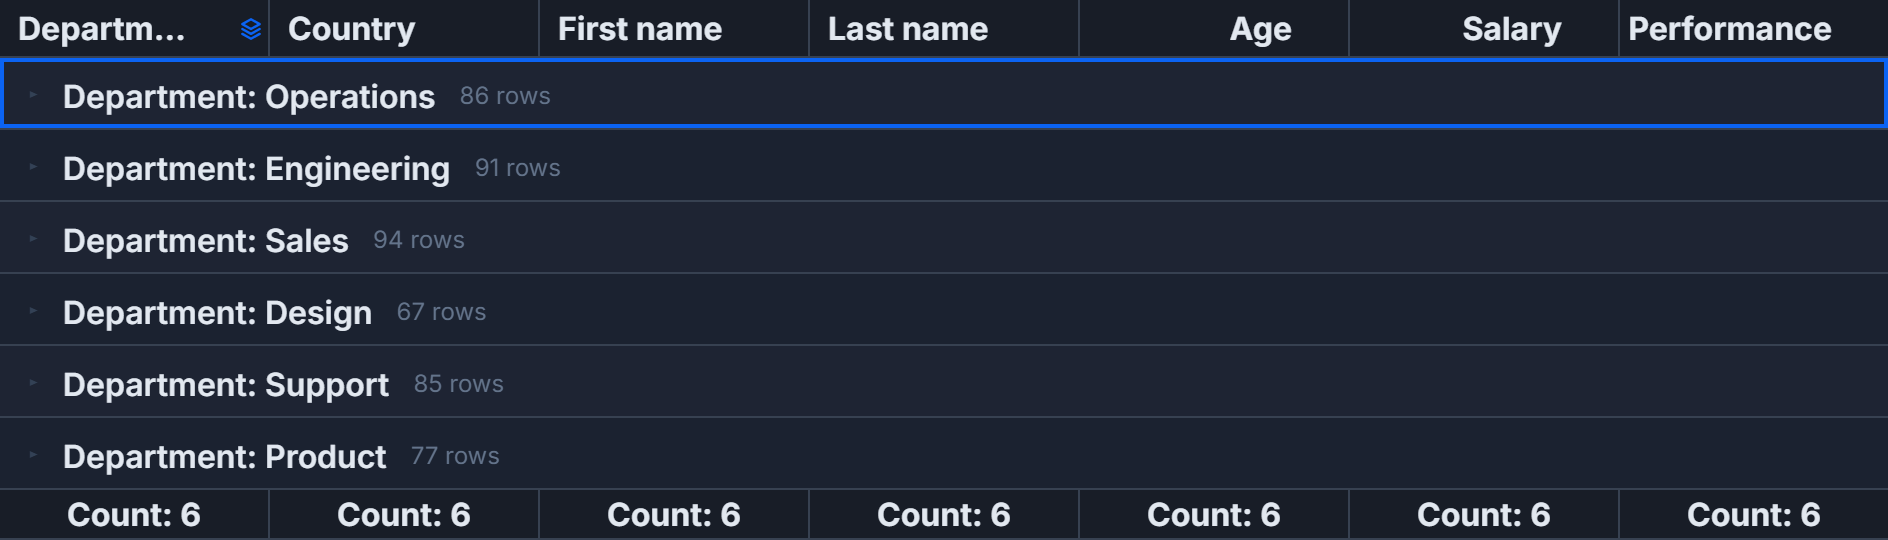 Group footers with per-column aggregations and a grand total summary row.
Attaching an aggregation to a column
Aggregations in SvGrid live on the column definition, not on the grid. Each column declares what it wants to compute, and the grid wires up both group footers and the summary row automatically.
<script lang="ts">
  import SvGrid from '@svgrid/grid'
  import {
    tableFeatures,
    columnGroupingFeature,
    type ColumnDef,
  } from '@svgrid/grid'

  type Order = {
    id: string
    region: 'AMER' | 'EMEA' | 'APAC'
    status: 'open' | 'paid' | 'refunded'
    amount: number
    createdAt: string
  }

  const features = tableFeatures({ columnGroupingFeature })

  const columns: ColumnDef<typeof features, Order>[] = [
    {
      id: 'region',
      field: 'region',
      header: 'Region',
      groupable: true,
    },
    {
      id: 'status',
      field: 'status',
      header: 'Status',
    },
    {
      id: 'amount',
      field: 'amount',
      header: 'Revenue',
      width: 130,
      align: 'right',
      aggregate: 'sum',
      format: {
        type: 'currency',
        currency: 'USD',
        options: { minimumFractionDigits: 2 },
      },
    },
    {
      id: 'aov',
      field: 'amount',
      header: 'Avg Order',
      width: 120,
      align: 'right',
      aggregate: 'avg',
      format: {
        type: 'currency',
        currency: 'USD',
        options: { minimumFractionDigits: 2 },
      },
    },
    {
      id: 'order_count',
      field: 'id',
      header: 'Orders',
      width: 80,
      align: 'right',
      aggregate: 'count',
    },
  ]

  let orders: Order[] = $state([])
</script>

<SvGrid
  data={orders}
  {columns}
  {features}
  groupable
  enableRowSummaries={true}
  containerHeight={540}
/>
A few things to notice here. Two columns reference the same field: 'amount' but declare different aggregators - one for the total, one for the mean. That is intentional: you can put the same field in multiple columns with different display roles. The count on id does not count distinct IDs or sum anything about them; it counts how many rows fell into that group bucket.
What each function actually computes
All five built-ins are folds over the group's row set. For a group G and a field f:
| Aggregator | Formula |
|---|---|
sum |
G.reduce((a, r) => a + (r[f] ?? 0), 0) |
avg |
sum(G, f) / nonNullCount(G, f) |
min |
Math.min(...G.map(r => r[f])) |
max |
Math.max(...G.map(r => r[f])) |
count |
G.length |
The denominator for avg uses the count of rows where the field is not null - not G.length. That distinction matters when your dataset has optional fields. A column with 80 values in a 100-row group should average those 80, not divide the sum by 100.
SvGrid runs these folds against the displayed row set: after filtering and sorting, before pagination. That means the number at the bottom of a filtered table matches what the user is looking at. It is almost always the right default.
The average-of-averages trap
This one shows up in production dashboards surprisingly often. Imagine three regions: AMER with 30,000 orders, EMEA with 3,000, APAC with 300. Each shows a per-region average order value in its group footer - correct. Then the summary row at the bottom needs a "grand mean".
The wrong approach is summing the three per-group averages and dividing by three. That weights APAC the same as AMER, which is mathematically wrong and commercially misleading.
SvGrid's built-in avg at the summary level computes sum(amount across all rows) / count(all rows), which is the correct weighted mean. The trap only bites when you write a custom aggregator that reduces across group results rather than raw rows. If you are writing a custom reducer for the summary level, always fold over rows, not over group totals.
When count is not what you mean
aggregate: 'count' counts rows. Sometimes that is right. Sometimes the user means "how many distinct customers placed orders" and your data has 500 rows from 42 customers.
// Three different "count" semantics:

// (a) Row count - what aggregate: 'count' gives you
G.length

// (b) Non-null field count - rows where the field has a value
G.filter((r) => r[field] != null && r[field] !== '').length

// (c) Distinct value count - unique values in a field
new Set(G.map((r) => r[field])).size

// For (b): use a custom aggregator function
{
  id: 'filled',
  field: 'amount',
  header: 'Non-Empty',
  aggregate: (rows) => rows.filter((r) => r.amount != null).length,
}

// For (c): also a custom aggregator
{
  id: 'regions',
  field: 'region',
  header: 'Regions',
  aggregate: (rows) => new Set(rows.map((r) => r.region)).size,
}
The custom aggregator signature receives the group's row objects, not just field values, so you can reference multiple fields in one computation - useful for weighted averages, ratios, or any business-specific metric.
Numeric coercion and silent NaN
If your data comes from an API that returns numbers as strings, Number("1200") is fine. Number("1,200") is NaN. And NaN + anything is NaN, so a single malformed row poisons the whole column's sum.
Defensive pattern: sanitize in the column accessor before any aggregation runs.
function parseAmount(raw: unknown): number {
  if (typeof raw === 'number') return raw
  if (typeof raw === 'string') {
    const cleaned = raw.replace(/[^0-9.-]/g, '')
    const n = parseFloat(cleaned)
    return isNaN(n) ? 0 : n
  }
  return 0
}

// In the column def:
{
  id: 'amount',
  field: 'amount',
  header: 'Revenue',
  aggregate: (rows) => rows.reduce((a, r) => a + parseAmount(r.amount), 0),
  align: 'right',
}
Using a custom aggregator here instead of 'sum' gives you control over the coercion. The built-in 'sum' applies Number() which will propagate NaN from strings like "$1,200".
Server-paged data has no client-side total
This is the biggest footgun. When the grid is paged from a server and showing 50 rows out of 12,000, aggregate: 'sum' sums those 50 rows. The footer will show the revenue for the current page only - and that number looks plausible enough that no one catches it until someone compares it with accounting.
For server-side data, the totals must come from the server:
<script lang="ts">
  import SvGrid from '@svgrid/grid'
  import { createServerDataSource, type ColumnDef } from '@svgrid/grid'

  type OrderPage = {
    rows: Order[]
    total: number
    aggregates: {
      amount_sum: number
      amount_avg: number
      order_count: number
    }
  }

  // Server returns aggregates alongside the page
  const ds = createServerDataSource({
    fetch: async ({ page, pageSize, sort, filters }) => {
      const res = await fetch(`/api/orders?page=${page}&size=${pageSize}`)
      const json: OrderPage = await res.json()

      // Store aggregates so the custom footer can read them
      serverAggregates = json.aggregates

      return { rows: json.rows, total: json.total }
    },
  })

  let serverAggregates = $state({
    amount_sum: 0,
    amount_avg: 0,
    order_count: 0,
  })
</script>
Then render the server-provided totals in a custom footer snippet rather than relying on the built-in aggregator. This makes the data source explicit about what is a page subtotal versus a dataset total - a distinction that matters a lot in financial dashboards where "total revenue" should never mean "this page's revenue".
Choosing the right aggregator
A rough decision tree for numeric columns:
- Default to
sumfor anything additive: amounts, quantities, durations, counts. - Use
avgwhen the central tendency matters more than the total: response times, scores, satisfaction ratings. - Use
min/maxfor range displays: "earliest order", "highest price in category", "fastest delivery time". - Use
countwhen you need to see how many rows are in each group, regardless of column values. - Use a custom function for anything business-specific: weighted averages, non-null rates, distinct counts.
avg and count are the two that cause the most confusion in practice, for the reasons above. If you are not sure which one the user means when they say "how many X", ask before building the column - the answer almost always determines which of the three count semantics applies.
Related posts: sticky-summary-footer-row, server-side-data-source, what-is-a-pivot-table